
Can XLM hold $0.14 as bearish traders tighten their grip on Stellar?

AI Sentiment: 18/100 Bearish
This score is generated through AI-driven analysis of the article's content.

powered by

Buy a downside put spread on XLM (e.g., buy puts around $0.14 and sell lower-strike puts) to monetize the $0.142–$0.139 support test. The article flags a “decisive daily close” below that range as the trigger for deeper downside; the spread limits cost while still paying if $0.14 fails.
Key Risk: Support holds and XLM reclaims the EMA resistance zone (≈$0.173–$0.178), causing put values to collapse.
Sell XLM (spot or perpetuals) while it’s below the 50/100/200-day EMA cluster (≈$0.173–$0.190). The setup is bearish: long-to-short is 0.90 (more shorts than longs), funding is negative (-0.0215%) showing bears are still in control, and price is pressing toward the $0.142–$0.139 support band. If $0.14 breaks, expect a fast move lower as stops and momentum selling stack.
Key Risk: XLM gets a daily close back above ~$0.173–$0.178 and funding flips positive, signaling bears are trapped and a real rebound is underway.
- XLM extends its correction to $0.154 and remains below all major daily EMAs.
- A long-to-short ratio of 0.87 for XLM signals a bearish tilt among traders.
- XLM could fall toward $0.142 if the bearish trend persists in the near term.
Stellar XLM remains under pressure on Tuesday as uncertainty across the broader cryptocurrency market and weak technical momentum weigh on Stellar.
XLM is down by more than 2% in the last 24 hours, extending its corrective decline beneath $0.155.
Mixed derivatives and on-chain indicators point to cautious sentiment, leaving XLM at risk of additional losses.
XLM maintains bearish bias despite Bitcoin’s rally
XLM is underperforming despite Bitcoin hitting the $64,000 level on Monday. The bearish performance comes as derivatives data indicates that traders are reducing their positions in the market.
CoinGlass data shows that the long-to-short ratio for XLM stands at 0.90. A reading below one means short positions outnumber long positions, indicating that more traders are betting on prices falling than rising.
The funding rate also supports the current bearish price action. XLM’s funding rate turned negative on Tuesday and now reads -0.0215%.
A negative funding rate indicates that traders holding short positions are paying those with long positions, suggesting that the bears are in control of the market.
Similar to XRP, XLM’s CryptoQuant indicators suggest a bearish outlook. The indicator shows sell-side dominance across its markets alongside large whale orders.
These conflicting signals suggest that major participants remain active, but selling pressure continues to control the near-term trend.
The derivative data has supported the bearish price action in recent weeks.
While Bitcoin has been consolidating between $62,000 and $64,000 in recent weeks, XLM has lost 17% of its value in the last one month and could record further losses in the near term.
XLM price outlook: Stellar approaches oversold conditions
The XLM/USD 4-hour chart is bearish and efficient as Stellar trades at approximately $0.154 on Tuesday, extending its decline below all major daily EMAs.
The 50-day EMA at $0.173, the 100-day EMA at $0.178 and the 200-day EMA at $0.190 form a significant resistance cluster.
As long as XLM remains below these levels, the broader technical outlook will remain bearish.
The RSI is near 36, placing XLM close to oversold territory. Meanwhile, the MACD has turned marginally positive around its zero line, suggesting that selling momentum may be weakening.
However, neither indicator confirms a sustainable recovery while the price remains below the major moving averages.
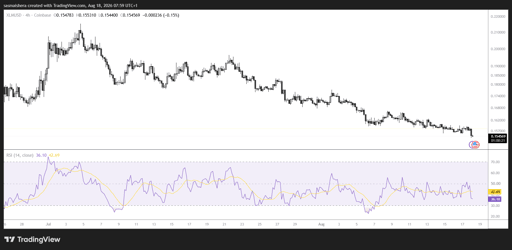
The first meaningful resistance sits around $0.173, where the 50-day EMA aligns with the 78.6% Fibonacci retracement. The next barriers are located at $0.177 and the 100-day EMA at $0.178.
A stronger recovery could target the 200-day EMA at $0.190, followed by Fibonacci resistance at $0.200, $0.218, $0.237 and $0.260. The cycle high near $0.298 remains a distant target.
On the downside, XLM could test the support zone between $0.142 and $0.139. A decisive daily close below this range would strengthen the bearish outlook and could trigger a deeper decline.

Dogecoin looks weak below $0.07, yet one signal hints the selloff is fading

Why is XRP falling below $1 even as Ripple expands its banking footprint?

Ethereum struggles near $1,900 as BitMine bets ETH will beat Bitcoin

Zcash climbs as $1.6B floods Ironwood: is a bigger ZEC breakout coming?

Bitcoin jumps above $64K as whale buying puts $66K breakout in play
No results found
Loading articles...
Failed to load articles. Please try again.