
Ethereum’s breakout setup is getting harder to ignore as bulls press $2,550

AI Sentiment: 72/100 Bullish
This score is generated through AI-driven analysis of the article's content.

powered by

Buy Ethereum (ETH) for a breakout attempt. Setup: ETH is above the 50/100/200-day EMAs (buyers in control) and RSI ~60 shows momentum without being stretched. Futures volume is up 74% vs spot, with long-to-short slightly favoring longs and positive funding (0.0070%) confirming bullish positioning. Catalyst: a clean break and hold above $2,550 opens a path to $3,000.
Key Risk: ETH rejects at $2,550 and then breaks below the 50-day EMA (~$2,264), turning this into a failed breakout and pushing price toward ~$2,000.
Buy an ETH upside call spread (e.g., buy 2,600 call, sell 2,900 call) to monetize the $2,550 resistance test while limiting premium risk. Rationale: the article flags improving bullish futures activity and ETF inflows last week; if ETH clears $2,550, upside momentum should accelerate toward $3,000. If it stalls, the short call caps losses.
Key Risk: Funding flips negative or rises sharply (bulls stop paying shorts), signaling crowded longs unwind and ETH fails to sustain above $2,550.
- US Spot Ethereum ETFs recorded a net inflow of $196.90 million last week.
- Ethereum must clear the $2,550 resistance in the near term to target $3,000.
- Immediate support extends from $2,264 to $2,146, with bulls holding the structure.
Ethereum ETH began the week near important technical levels after falling approximately 1.5% during the previous week.
Bitcoin is consolidating above its major daily moving averages, while Ethereum is approaching resistance at $2,550.
Technical indicators suggest that the bulls are still in control, with rising futures volume also painting a bullish picture.
Ethereum futures volume reaches $36.45 billion
Ethereum climbed above $2,500 on Monday as derivatives traders increased their activity, with futures turnover substantially outpacing spot-market volume.
Data obtained from CoinGlass shows that Ethereum futures generated $36.45 billion in trading volume during the 24 hours, representing a 74% increase.
It is 14 times higher than the $2.48 billion spot volume recorded over the last 24 hours.
Ethereum futures open interest now stands at $32.86 billion. Open interest measures the value of outstanding derivatives contracts that have yet to be settled or closed.
A high reading indicates substantial capital remains committed to the market, although the headline figure alone does not reveal whether traders are predominantly bullish or bearish.
The long-to-short ratio stands at 1.019, indicating a slight bias toward long positions, while the positive funding rate shows longs are paying shorts.
Furthermore, the funding rate of 0.0070% adds further confluence to the bullish narrative in the Ethereum market.
Spot Ethereum ETFs also ended the week positively last week, following the $216.40 million inflow recorded on Friday.
Following the muted inflow on Monday, the ETFs recorded an outflow of $24.30 million and $29.90 million on Tuesday and Thursday.
In addition to the $216 million inflow recorded on Friday, the funds also attracted $34.70 million on Wednesday, bringing the total weekly inflow to $196.90 million.
For Ethereum to extend its rally, the spot ETFs would need to pick up from where they left off last week.
Ethereum approaches the $2,550 resistance
Ethereum traded near $2,511 on Monday, placing it within reach of the key $2,550 resistance level.
ETH remains above its 50-day EMA at $2,264, its 200-day EMA at $2,203, and its 100-day EMA at $2,146. The concentration of these indicators below the current price suggests that buyers continue to support the market.
The RSI sits near 60, reflecting improving bullish momentum without signaling overbought conditions.
However, the MACD remains negative, showing that the latest recovery still lacks strong upside conviction.
A decisive move above $2,550 could allow Ethereum to target the psychological $3,000 level.
If Ethereum encounters rejection at $2,550, its 50-day EMA near $2,264 represents the first notable support.
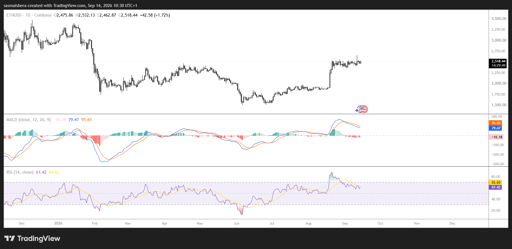
Additional demand could emerge around the 200-day EMA at $2,203 and the 100-day EMA at $2,146. Losing these levels would increase the risk of a decline toward the structural support at $2,000.
Only a sustained breakdown below $1,385 would seriously weaken Ethereum’s broader bullish structure.
Holding above $2,500 could strengthen short-term sentiment and encourage traders to target higher resistance levels.
However, ETH will need sustained spot demand to make the advance more durable.
A rally driven mainly by futures positioning could fade quickly if funding costs rise or broader market sentiment deteriorates.

CLARITY Act Senate vote on Tuesday: what to expect

Why XRP may need more than ETF inflows to break above $1.40

Will Bitcoin break $80,000 or fall to $75,000 as the Fed decision draws close?

Top crypto price predictions today: Pi Network, Pepe Coin, Zcash

ADA shorts are piling in: could $0.20 trigger a violent Cardano rebound?
No results found
Loading articles...
Failed to load articles. Please try again.