
Is Ethereum price at risk of a drop below $2,400?

AI Sentiment: 28/100 Bearish
This score is generated through AI-driven analysis of the article's content.

powered by

Use options to monetize the specific downside trigger: liquidation concentrations just below $2,400. Buy ETH puts around the $2,400 area to profit if ETH breaks $2,460 and accelerates through $2,400 toward $2,300. This directly targets the event-driven volatility around the Fed and the technical breakdown levels.
Key Risk: ETH rallies back above $2,520 and clears $2,535–$2,600, keeping price away from $2,400 and crushing put value.
ETH is failing to hold $2,500 and is getting rejected repeatedly between $2,535–$2,600. With Fed decision risk tomorrow and leveraged longs clustered near $2,466 and $2,391, a break below $2,460 can cascade into $2,400 then $2,300 and the Supertrend near ~$2,242. Sell ETH now while price is still below the $2,520 4-hour VWAP and momentum is weakening.
Key Risk: ETH holds above $2,460 and reclaims $2,520, then breaks and sustains through $2,535–$2,600 (squeezes shorts and invalidates the downside cascade).
- Ethereum has fallen roughly 2% to $2,480 after a rejection near $2,600.
- A break below $2,460 could put $2,400 and $2,391 in focus.
- Daily CMF and short-term momentum have weakened.
Ethereum has fallen roughly 2% over the past 24 hours to trade near $2,480 on Sept. 15, putting ETH at risk of slipping below $2,400 if selling continues.
CoinGecko data shows the decline followed a sharp rejection from an intraday high near $2,606, extending ETH's repeated failure to establish $2,500 as support.
The rejection extended a series of failed attempts to establish $2,500 as support.
ETH has repeatedly moved above the level only to meet selling between roughly $2,535 and $2,600, leaving buyers unable to hold the breakout.
Macro uncertainty has weighed on the latest attempt, with the Federal Reserve due to announce its interest rate decision on Sept. 16.
Markets have moved towards expectations for tighter monetary policy, with recent market estimates putting the probability of a rate increase above 80%.
Traders have consequently been reducing exposure to risk assets before the decision, while ETH entered the event after gaining strongly over the previous several weeks.
Institutional demand has remained positive despite the price decline.
US spot Ether exchange-traded funds recorded roughly $216.4 million in net inflows on Sept. 11, including around $148.8 million for BlackRock's ETHA.
Across the five trading sessions through Sept. 11, the funds attracted approximately $222.8 million in net inflows.
Another roughly $121 million entered the products during the latest reported session.
Those inflows have so far failed to absorb the selling between $2,535 and $2,600.
ETH's latest move illustrates the pressure around that area: buyers carried the token from below $2,500 to roughly $2,606 before sellers pushed it back towards $2,480.
Derivatives positioning could make a break below current support more volatile.
CoinGlass puts aggregate Ether futures open interest near $32.6 billion, while liquidation data shows concentrations of leveraged long positions around $2,466 and $2,391.
A fall through $2,460 could therefore trigger long liquidations as leveraged positions are closed, with the second liquidation concentration sitting just below $2,400.
ETH price analysis
ETH's daily chart shows price trading near $2,480 after failing to hold the move towards $2,600, but it remains above the Supertrend indicator, which sits near $2,242.
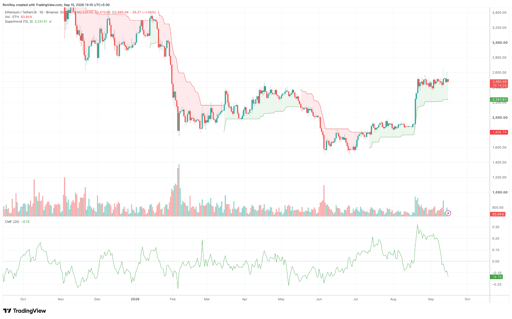
ETH/USDT 1-day price chart. Source: TradingView.
The Supertrend has remained below the price since ETH recovered from its August lows, keeping the larger daily trend intact despite the latest fall.
A move below $2,400 would expose the $2,300 area before the Supertrend near $2,242 becomes the main level for the current daily structure.
Money flow has deteriorated much faster than the Supertrend. The daily Chaikin Money Flow has fallen to roughly -0.13 after spending much of the recent recovery above zero.
A negative CMF reading means selling volume is currently outweighing buying volume, which fits ETH's repeated failure to stay above $2,500.
Price would need to recover $2,500 and then break through the $2,535-$2,600 supply area to weaken the immediate downside case.
Holding above $2,600 would reopen the path towards the August highs around $2,700-$2,800.
On the 4-hour chart, ETH has fallen below its multi-timeframe VWAP near $2,520 after trading above it during the push towards $2,600.
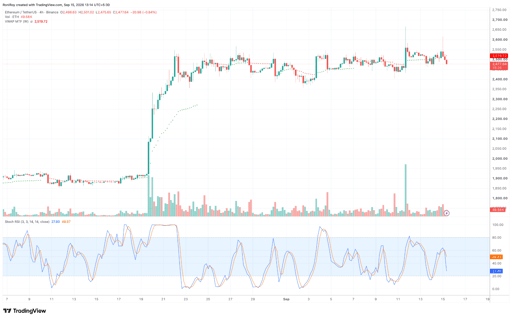
ETH/USDT 4-hour price chart. Source: TradingView.
Price remaining below $2,520 would keep the latest intraday move tilted towards the $2,460 area.
The 4-hour Stochastic RSI has fallen sharply, with its faster line near 27.8 and the slower line around 49.9.
The faster line moving below the slower line while both decline shows that short-term momentum has weakened since the $2,600 rejection.
A decisive break below $2,460 would put $2,400 in range, followed by the liquidation concentration around $2,391.
If selling accelerates across crypto exchanges and extends through that area, the daily chart leaves room towards $2,300 and eventually the Supertrend support near $2,242.
A recovery above the 4-hour VWAP near $2,520 would be the first sign that buyers are regaining control.
ETH would still need to clear $2,535-$2,600 before the repeated failures around $2,500 can be treated as resolved.

Will these four macro threats push Bitcoin below $76,000 this week?

XRP jumps 6% as traders turn bullish, but overheating signals are flashing

Stellar price surges 6% before Protocol 28 vote: can XLM break $0.20?

Can HYPE reclaim $90 after bouncing from $77?

Zcash price slips from $1,300: could ZEC fall to $850 before targeting $2,500?
No results found
Loading articles...
Failed to load articles. Please try again.