Uniswap’s $100 dream hits reality check as UNI falls below $3

AI Sentiment: 35/100 Bearish
This score is generated through AI-driven analysis of the article's content.
powered by
Buy UNI on a reclaim of $3.00 with confirmation (hold above $3 on the 4H). The Standard Chartered catalyst already pulled in momentum and positioning; the market is now consolidating around $2.98 with buyers still controlling the Bollinger midline (~$2.77). A clean break above $3 should trigger a squeeze as nearby leveraged shorts cluster around $2.95 and get forced out, with upside magnets at $3.20 then $3.35.
Key Risk: UNI fails back below $2.95 and slides into $2.90/$2.85, proving the rally was just a short-covering spike.
Sell UNI via short-dated futures/puts if UNI rejects $3.10–$3.22. The article shows dense liquidation supply above $3.10–$3.22 and heavy profit-taking near $3.70; Chaikin Money Flow has cooled, meaning inflows are slowing. If price can’t push through $3.22, leveraged longs are likely to unwind and price can mean-revert back toward $2.95.
Key Risk: UNI breaks and holds above $3.22, forcing a squeeze toward $3.20 and then $3.35.
- UNI has slipped below $3 after a forecast-driven rally.
- Profit taking has slowed upside momentum.
- Key levels sit at $2.95 support and $3.10 to $3.20 resistance.
Uniswap has retreated below $3 after surrendering part of a sharp rally that briefly pushed the token above $3.60 following a bullish long-term forecast from Standard Chartered.
According to CoinGecko data, UNI traded near $2.98 on June 23, holding roughly 20% above its June 15 level despite falling from a local peak reached earlier in the week.
The decline comes after a rapid repricing event that followed Standard Chartered's initiation of coverage on the decentralized exchange token and its projection that UNI could reach $100 by 2030.
At the time the forecast was published, UNI was trading below $2.50 after months of weakness.
Fresh buying interest quickly lifted the token through several resistance levels, while derivatives traders added leveraged positions as momentum accelerated.
Earlier, Standard Chartered's head of digital assets research Geoffrey Kendrick wrote that Uniswap could benefit from rising decentralized exchange activity and gain a larger share of on-chain trading volumes over time.
"We initiate coverage of Uniswap with a UNI-USD price forecast of USD 100 by end-2030, a 40x increase from today’s USD 2.50 level," Kendrick said.
Data from CoinGlass showed futures activity climbed alongside the rally as traders rushed to position for further upside.
Much of that enthusiasm faded after UNI approached the $3.70 area, where profit-taking emerged and buying momentum began to cool.
Recent on-chain activity suggests the market remains divided over UNI's next move.
While some large holders reportedly reduced exposure into the rally, blockchain tracking data shared by market observers showed a DeFi investor deposited $300,000 in USDT to Binance and purchased roughly 100,000 UNI near $2.99.
The same wallet was reported to still hold approximately USD 2.8 million (approx. $4 million) in stablecoins, a development some traders interpreted as a sign of continued interest around current levels.
9 hours ago:
— Nazoku (@Nazo_ku) June 21, 2026
- A DeFi investor (0x176) deposited $300k USDT to Binance to buy 100k $UNI at $2.99.
- He is a crypto millionaire currently holding 2.765m USDT in his personal wallet.
This guy definitely knows something is about to happen!https://t.co/sZ8GIn70Xc https://t.co/ezJAI9UJev pic.twitter.com/CKUk1EKlco
UNI price analysis
Technical indicators suggest UNI has entered a consolidation phase after the explosive rally.
On the daily chart, UNI remains above the Bollinger Bands midline near $2.77, indicating that buyers have retained control of part of the recent advance.
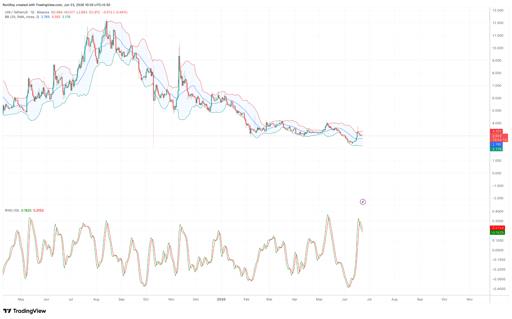
UNI/USDT 1-day price chart. Source: TradingView.
The upper Bollinger Band sits near $3.35, placing a key resistance zone above current prices.
Momentum also remains constructive on the Relative Vigor Index, which is still above zero despite turning lower after its recent spike.
Short-term indicators paint a more balanced picture.
On the four-hour chart, UNI is trading almost directly on its session VWAP around $2.98, a sign that buyers and sellers have reached temporary equilibrium following the sharp move higher.
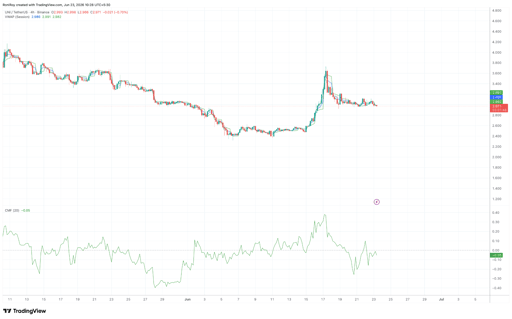
UNI/USDT 4-hour price chart. Source: TradingView.
Meanwhile, the Chaikin Money Flow indicator has slipped slightly below zero after posting strong positive readings during the rally, suggesting fresh capital inflows have slowed.
Liquidation data points to several levels that could determine UNI's next direction.
CoinGlass liquidation heatmaps show the largest concentration of nearby leveraged positions clustered around $2.95, a price level that has repeatedly tested over the past day.
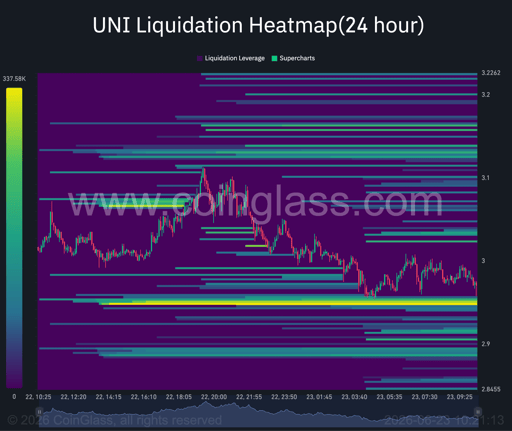
UNI 24-hour liquidation heatmap. Source: Coinglas.
Additional liquidity pockets sit near $2.90 and $2.85, making those areas potential downside targets if support fails.
Above the market, liquidation clusters become increasingly dense between $3.10 and $3.22.
Should UNI reclaim momentum and move through the $3 level decisively, those leveraged short positions could become vulnerable, potentially creating a squeeze toward the $3.20 region.
Beyond that area, technical resistance from the upper Bollinger Band near $3.35 and the recent swing high around $3.70 would likely attract attention from traders.
Macro conditions continue to influence sentiment.
Following the Federal Reserve's latest policy decision under Chair Kevin Warsh, expectations for higher interest rates over a longer period have weighed on risk assets across crypto markets.
As Bitcoin and Ethereum lost momentum, speculative capital also pulled back from rallying altcoins, including UNI.
At the moment, support near $2.95 continues to attract buyers, while failure to breach past $3.70 shows sellers remain active at higher levels.
Unless either side breaks those boundaries decisively, price action may remain concentrated within the current range.

Can Pi Network price recover as Protocol v25 upgrade offers fresh catalyst?
Why is Ethereum falling after briefly breaking above the $1,930 level?

OKX (OKB) slides 2% amid crypto sell-off: key levels to watch

BNB price outlook: Binance Coin targets $647 as bullish pattern takes shape

US moves $297M in seized crypto to Coinbase Prime despite no-sell vow
No results found
Loading articles...
Failed to load articles. Please try again.