
Ethereum price prediction: ETH eyes $2,000 as exchange outflows explode

AI Sentiment: 78/100 Bullish
This score is generated through AI-driven analysis of the article's content.

powered by

Buy Ethereum (ETH) spot for a breakout setup: the double-bottom points to a move if ETH clears $1,800–$1,805, with next resistance at $1,860 and upside toward $1,950 then $2,134. Momentum confirms (RSI > 50, MACD bullish crossover). The exchange outflow surge supports the move because less ETH sits on exchanges, reducing easy sell supply.
Key Risk: ETH breaks and holds below $1,609, invalidating the double-bottom and turning the recovery into another leg down.
Sell/short ETH on any failed breakout attempt into $1,860 using ETH perpetual futures: the same technical levels that look bullish ($1,800–$1,805, then $1,860) can trap late longs if price rejects after the outflow headline fades. Use this as a momentum-failure trade—fade strength until ETH proves it can hold above $1,860.
Key Risk: ETH sustains above $1,860 and accelerates toward $1,950+, making the rejection thesis wrong.
- ETH must clear $1,800-$1,860 to strengthen bullish momentum.
- Binance saw $1.23B in weekly ETH exchange outflows.
- $1,609 remains the key support for the current setup.
Ethereum ETH traded around $1,765 on July 6 after posting a strong recovery over the past week.
The cryptocurrency gained 12.2% in seven days and 12.4% over the last month, even as it remained about 64.3% below its all-time high of $4,946.05, which was reached in August 2025.
The latest recovery has drawn attention because technical indicators and on-chain data are pointing in the same direction.
Double bottom pattern puts $1,800 resistance in focus
Ethereum spent the past several weeks recovering from lows near $1,550, bringing the price back to the $1,750-$1,800 range.
That recovery has created what technical traders identify as a potential double bottom, a chart formation that often signals the end of a downtrend if the price breaks above its neckline.
The key level now sits between $1,800 and $1,805, with additional resistance around $1,860.
A sustained move above that zone would strengthen the bullish technical structure and shift attention toward $2,134.
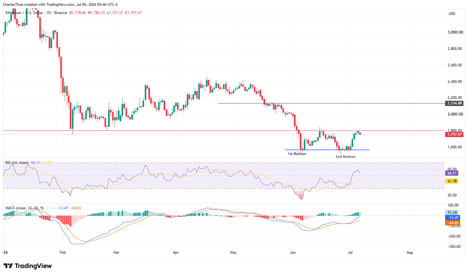
Momentum indicators have also improved alongside the recovery.
The Relative Strength Index (RSI) has climbed above the neutral 50 level, showing stronger buying momentum than was seen during the previous decline.
Meanwhile, the Moving Average Convergence Divergence (MACD) indicator has produced a bullish crossover, with the MACD line moving above the signal line as the histogram continues to expand.
Despite these positive developments, support remains equally important. Analysts continue to watch $1,609 as the main invalidation level for the current setup.
A decisive break below that price would weaken the double bottom structure and reduce the probability of a continuation toward higher resistance levels.
Record exchange outflows point to accumulation
On-chain activity has added another layer to Ethereum's recent recovery.
During the past week, Binance recorded approximately USD 1.2 billion (approx. $1.8 billion) worth of net ETH outflows, marking the largest weekly withdrawal from the exchange in more than three years.
The network also recorded more than 166,000 ETH withdrawal transactions in a single day, another three-year high.
Binance ETH withdrawing transactions hit a 3-year high
— CryptoQuant.com (@cryptoquant_com) July 3, 2026
“Binance logged more than 166,000 withdrawal transactions in a single day, a level not seen in over 3 years.” – By @Darkfost_Coc
Full analysis ⤵️https://t.co/OYO4Id7bKZ pic.twitter.com/VawmvJd1Km
Large exchange outflows reduce the amount of ETH immediately available for trading on centralised exchanges.
When investors move assets into self-custody or decentralised finance applications instead of leaving them on exchanges, selling pressure can decline if demand remains steady.
Notably, the increase in withdrawals comes as Ethereum has held above important support levels despite broader market caution.
Although investor sentiment has remained subdued, the combination of resilient price action and strong on-chain activity has become one of the main themes supporting the current technical outlook.
Ethereum Foundation restructuring shifts focus to core development
Ethereum has also remained in focus because of significant changes within the Ethereum Foundation.
The Foundation recently announced a restructuring that includes a 40% reduction in its budget and a 20% reduction in staff.
The changes are designed to create a leaner organisation with greater emphasis on protocol security, scalability, usability and decentralisation.
The restructuring does not change how Ethereum itself operates.
The blockchain continues to rely on a broad ecosystem of developers, researchers, validators, companies and community contributors rather than a single organisation.
Alongside the restructuring, initiatives such as EthLabs are expected to play a larger role in supporting institutional adoption and ecosystem growth.
Ethereum developers are also continuing longer-term work on protocol improvements, including research into quantum-resistant cryptography over the coming years.
Ethereum price outlook
Ethereum's current technical picture revolves around a relatively narrow group of price levels.
The immediate resistance remains between $1,800 and $1,805, followed by $1,860.
A successful breakout above those levels would place $1,950 into focus, while completion of the broader double bottom pattern could eventually support a move toward $2,134.
On the downside, traders continue to monitor $1,609 as the key support that maintains the current bullish structure.
With ETH trading around $1,765, the market is entering a critical phase where technical confirmation, exchange flow data and continued buying pressure will determine whether the recent recovery develops into a larger trend reversal or remains a short-term rebound.

Why is Bitcoin price struggling around $80,000?

Zcash price breaks above $1,000 as institutional and privacy demand rise

Is XRP quietly building toward $1.90 as macro pressure eases and demand holds?

Bitcoin price defends $80,000 as bulls prepare another run at $82,000

Strategy, Coinbase stocks rally as Bitcoin reclaims $80,000
No results found
Loading articles...
Failed to load articles. Please try again.