
Can LIT price reach $3 as Robinhood Chain rumours fuel the rally?
AI Sentiment: 72/100 Bullish
This score is generated through AI-driven analysis of the article's content.

powered by

Buy LIT. Robinhood Chain points speculation is pulling incremental attention, but the real setup is demand stacking: whale accumulation near $2.00–$2.20 plus protocol buybacks that permanently burn repurchased LIT. Technically, LIT is pressing $2.50 with RSI ~61 and a clean higher-lows trend since May; a daily close above $2.50 targets $2.65–$2.75, then $3.
Key Risk: Rumors don’t convert into any real expansion/incentives, and the $2.50 breakout fails, triggering a fast selloff back below $2.28–$2.20.
Sell/short LIT if it rejects $2.50. The July supply zone ($2.65–$2.75) is the next magnet, but thin volume above $2.00 means rallies can snap back hard. If price tags $2.50 and momentum rolls (RSI back toward 50), fade the move with a tight risk window targeting a return to ~$2.35 then ~$2.20.
Key Risk: LIT holds above $2.50 and breaks into $2.65–$2.75; the short gets squeezed as momentum strengthens.
- LIT has gained 22% over the past week.
- Robinhood Chain rumours are driving fresh interest.
- Daily RSI and four-hour MACD readings remain bullish.
Lighter LIT price has gained more than 6% over the past 24 hours and roughly 22% over the past seven days as renewed rumors of a deeper Robinhood Chain integration have added to buying pressure already supported by whale accumulation and token burns.
CoinGecko data showed LIT trading around $2.48 on August 11, giving the token a market capitalization of more than $620 million.
The latest rally has taken LIT close to $2.50 and above the levels reached during its August 7 rally, when the token briefly traded around $2.43.
Over the past week, LIT has climbed from roughly $2.02 to $2.48. Much of the initial advance came between August 4 and August 7, before the token consolidated mostly between $2.28 and $2.37 through August 8–10.
Buyers returned on August 11, pushing the price toward a fresh seven-day high.
The latest leg of the rally has coincided with renewed market speculation over Lighter's relationship with Robinhood Chain, where the decentralized perpetual futures protocol already provides trading infrastructure.
Robinhood Chain rumors drive fresh interest in LIT
Recent attention has centered on a potential points program for Lighter users trading through Robinhood Chain.
Points are calculated and distributed weekly based on eligible trading activity, while the program's rules exclude wash trading, bots, Sybil activity and attempts to manipulate the scoring system.
The points already convert into LIT from a designated 11 million-token pool, but traders are speculating that the programme could eventually lead to additional incentives or a broader Lighter integration with Robinhood Chain.
Neither Lighter nor Robinhood has announced any further expansion beyond the integrations and rewards structure already in place.
Speculation has gained attention partly because the two platforms already have an established relationship.
When Robinhood launched its Layer 2 mainnet on July 1, perpetual futures were provided through Lighter, while eligible users of the redesigned Robinhood Wallet received access to Lighter's perpetual futures markets.
Lighter later expanded that connection by supporting Robinhood Stock Tokens as collateral for perpetual futures on Robinhood Chain.
Instead of relying only on stablecoins for margin, traders can use supported tokenized equities as collateral for their positions.
Activity on Robinhood Chain has also given traders another reason to watch Lighter's role in the ecosystem.
Bernstein analysts reported in July that the network had generated about $3.1 billion in weekly decentralized exchange volume.
Around 65,000 users held approximately $13 million in tokenized stocks and $300 million in stablecoins on the network at the time.
With Lighter already handling perpetual futures infrastructure and supporting Stock Tokens as collateral, the new points program has fueled speculation that its integration with Robinhood Chain could expand.
Whale buying supported LIT before the latest rally
While Robinhood speculation has become the latest catalyst, LIT entered August 11 after several days of buying activity linked to a large holder.
Last week, a whale accumulated approximately 3.38 million LIT worth around $7.37 million.
The same wallet later received another $5.5 million in USDS and USDC, prompting traders to watch whether the additional stablecoins would be used for further LIT purchases.
Buying around that period helped LIT gain nearly 10% on August 7, when its price reached approximately $2.43.
The whale had been accumulating as buyers became active around the $2.00–$2.20 region.
Price action since then has kept most of those gains intact. Instead of falling back toward the early-August range, LIT consolidated above roughly $2.28 before climbing past its August 7 level on Tuesday.
Lighter's buyback program provides another source of demand for the token.
Revenue generated by the exchange is used to purchase LIT from the open market, and the protocol changed its model earlier this year so that repurchased tokens are permanently burned rather than held in its treasury.
On July 10, Lighter burned 15,638,702 LIT acquired through programmatic buybacks through the end of the second quarter. The amount represented approximately 6.3% of the reported circulating supply before the burn.
Under the mechanism, higher exchange activity can generate more protocol revenue for LIT purchases, while subsequent burns remove the repurchased tokens from circulation.
LIT price analysis
LIT's daily chart shows that the latest rally remains supported by an ascending trendline that has guided the token higher since its May lows.
See below:
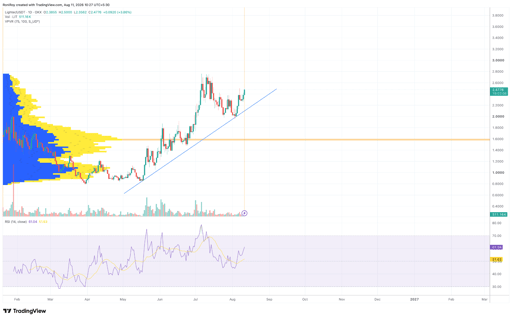
LIT/USDT 1-day price chart. Source: TradingView.
After trading near $0.80 in early May, LIT formed a sequence of higher lows as it advanced through $1.00, $1.50 and eventually $2.00.
The trendline connecting those lows remained intact during the late-July and early-August pullback, when buyers returned around $2.00.
At about $2.48 on Aug. 11, LIT is now approaching the upper end of the range established during July.
The first major test sits around $2.50, followed by the July swing-high region between roughly $2.65 and $2.75.
The daily Relative Strength Index supports the current bullish structure without yet showing an overbought reading.
RSI stood at 61.04, above its moving average of 51.63 and comfortably above the neutral 50 level.
A move toward 70 alongside a price breakout above $2.50 would show that momentum is strengthening as LIT approaches its July highs.
Conversely, an RSI reversal toward 50 while price fails to hold the breakout would weaken the current momentum setup.
Volume Profile Visible Range data adds another layer to the daily chart. The heaviest historical trading activity is concentrated substantially below the current price, with a major high-volume area around $1.50–$1.60.
Comparatively thinner volume above $2.00 means LIT has less historical trading activity to work through as it approaches the July highs.
However, the previous peak around $2.65–$2.75 remains an important supply zone because sellers rejected the token from that area several times in July.
The 4-hour chart provides a closer view of the current breakout attempt. LIT was trading around $2.48, almost directly against the upper Keltner Channel at approximately $2.495.
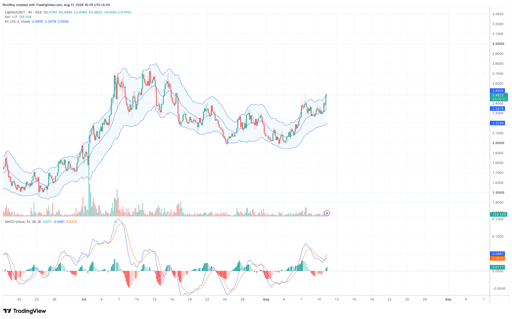
LIT/USDT 4-hour price chart. Source: TradingView.
The channel's middle line stood near $2.348, while its lower boundary was around $2.201.
Trading against the upper Keltner boundary shows that buyers currently control short-term momentum, but it also makes $2.50 important for the next leg.
A decisive close above the upper channel, followed by continued trading above $2.50, could open a move toward the July resistance region around $2.65–$2.75.
Momentum on the 4-hour MACD has also strengthened following the consolidation between August 8 and August 10.
The MACD line stood around 0.0481, above the signal line at 0.0370, while the histogram had returned to positive territory at approximately 0.0111.
The bullish crossover developed as LIT recovered from its latest pullback and approached $2.50, giving the breakout attempt momentum confirmation on the lower timeframe.
If buyers clear $2.50, the July swing highs around $2.65–$2.75 become the next technical target.
A breakout above that zone would put $3.00 into focus as the next psychological level, although the charts do not yet confirm such a move.
Failure to break $2.50 would instead leave the Keltner midline near $2.35 as the first short-term support.
Below it, the lower Keltner boundary sits near $2.20, while the daily ascending trendline currently provides structural support around the $2.05–$2.15 area.
LIT's 4-hour Keltner Channel placed its lower boundary at about $2.20 on August 11, close to the area where buyers had already become active during last week's whale accumulation.

Bahrain leads the Middle East stablecoin race, but where are the coins?

Could ADA rip past $0.21 as Cardano governance turns from risk to catalyst?

XRP has 11 days of ETF inflows, but is that enough to break the $1.40 ceiling?

XRP dips to $1.32 despite 11-day spot ETF inflow streak

How high can PI price go as Protocol 27 upgrade nears?
No results found
Loading articles...
Failed to load articles. Please try again.