
Is ETHFI price headed higher after a 30% gain in a week?

AI Sentiment: 74/100 Bullish
This score is generated through AI-driven analysis of the article's content.

powered by

ETHFI. The “Summer” neobank upgrade expands trading/borrowing/payments and tokenized stocks/metals, and Ether.fi routes protocol revenue into automatic ETHFI buybacks. Price is also breaking above the 50/100/200-day SMAs, with bullish MACD momentum. Buy now with upside to $0.55 then $0.60 if $0.52 breaks on a daily close.
Key Risk: The buyback/revenue link fails to translate into real token demand (revenue disappoints or buybacks slow), turning the breakout into a dead-cat bounce.
ETHFI. After a ~30% week and RSI ~75 on the 4-hour chart, fade the immediate $0.52 resistance: sell/trim into strength and re-enter only if it holds above the 4-hour Supertrend (~$0.466–0.47) or after RSI cools. This targets a volatility pullback while the long-term trend is still unproven (200-day just reclaimed).
Key Risk: Buyers clear $0.52 and hold it, pushing through $0.55 toward $0.60 without a meaningful pullback.
- ETHFI gained nearly 30% over the past week, breaking above $0.50.
- Ether.fi’s Summer release has added new trading, borrowing and fiat services.
- ETHFI has broken above its 200-day SMA as momentum strengthens.
Ether.fi price has climbed nearly 30% over the past seven days to around $0.51 as the token extends a rally that accelerated after the protocol rolled out a major update to its neobank product.
CoinGecko data showed ETHFI trading near $0.51 on August 17, up 7.7% over the previous 24 hours and 29.9% over seven days.
The token was also up 27.9% over two weeks and 16.9% over the past month, with most of the latest rally taking place since August 13.
The move has developed in stages. ETHFI traded around $0.37-$0.39 earlier in the week before breaking above $0.40 on August 13.
It then moved through $0.45 and $0.47 before reaching a weekly high near $0.52 on August 17.
Much of the renewed interest followed Ether.fi's Summer release on August 13, which expanded the project from its staking roots into more trading, borrowing, and payment services.
The update added tokenized stocks and metals through xStocks, allowing users to access those assets alongside crypto from the same app.
Ether.fi also added portfolio-backed borrowing through an integrated Aave market on Optimism, with borrowing rates around 4%.
Fiat access was expanded as part of the same release, with the app supporting more than 30 currencies and payment methods for moving money on and off the platform.
Ether.fi had already moved its product infrastructure to Optimism earlier this year. In an April update, the protocol said more than 70,000 active cards, over 300,000 accounts and more than $200 million in TVL had migrated to OP Mainnet.
More important for ETHFI itself, Ether.fi's product structure links revenue generated across its services with programmatic token purchases.
Ether.fi says part of protocol revenue is distributed to staked ETHFI holders through token buybacks.
The protocol's governance had previously approved buyback programs, including a treasury program authorizing as much as $50 million in ETHFI purchases while the token trades below $3.
The latest product structure extends that connection by directing revenue generated across Ether.fi's staking, payments, borrowing and trading products toward automatic ETHFI purchases.
Increased use of those products could therefore feed into purchases of the token, giving traders a token-specific catalyst alongside the Summer product launch.
Large-holder activity has provided another factor during the recent rally.
One whale withdrew roughly 5 million ETHFI, worth about $1.93 million, from Binance, while other large holders accumulated ETHFI through CoW Protocol.
Exchange withdrawals do not by themselves prove that tokens will be held long term, but moving ETHFI away from centralized exchange liquidity can reduce the amount immediately available for sale if the tokens are not subsequently returned.
ETHFI price analysis
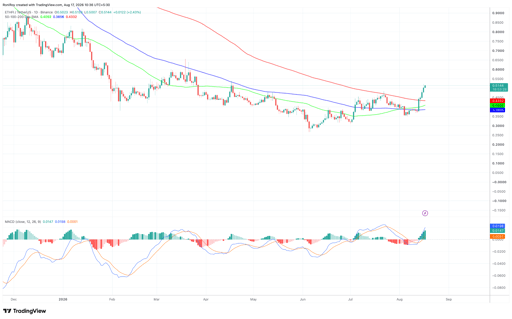
ETHFI's daily chart has now produced one of its greatest technical changes in months, with price breaking above the 50-day, 100-day and 200-day simple moving averages.
See below:
ETHFI/USDT 1-day price chart. Source: TradingView.
At roughly $0.514 at the time of analysis, ETHFI was trading above the 50-day SMA at $0.409, the 100-day SMA near $0.386, and the 200-day SMA around $0.433.
The 200-day SMA is particularly important because ETHFI had spent several months below the long-term average.
Holding above $0.433 would therefore keep the latest breakout intact on the daily timeframe.
The shorter 50-day SMA has also started moving higher, although it remains below the 200-day average, meaning the moving-average structure has not yet completed a longer-term bullish crossover.
Momentum has strengthened alongside the price breakout.
The daily MACD line had risen to roughly 0.0198, compared with a signal line near 0.0051, while the histogram expanded into positive territory around 0.0147.
A rising positive histogram combined with the MACD line moving further above its signal line shows that bullish momentum has accelerated during the latest leg higher.
If the histogram begins contracting while ETHFI struggles around $0.52, however, it would provide an early sign that the current impulse is losing strength.
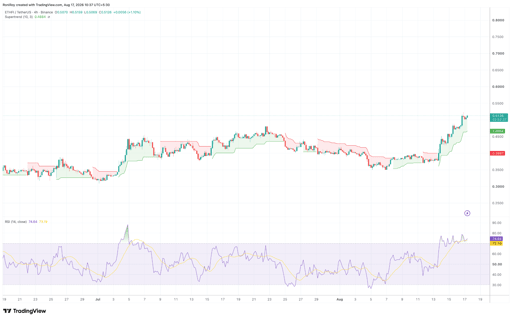
The 4-hour chart gives a similar bullish reading but also shows why ETHFI could face short-term volatility after its rapid rise.
ETHFI/USDT 4-hour price chart. Source: TradingView.
ETHFI remained above the four-hour Supertrend, which had moved up to approximately $0.466.
As long as price stays above that level and the indicator remains green, the short-term trend structure favors buyers.
The four-hour RSI was around 74.6, above its moving average near 73.2 and above the conventional 70 overbought threshold.
The reading confirms strong momentum, but it also shows that ETHFI has become stretched following the run from below $0.40.
Immediate resistance sits around $0.52, where the latest rally has stalled.
A daily close above that area could open a move toward $0.55, a level that previously acted as a trading zone earlier this year.
If buyers clear $0.55, the $0.60 area would become the next major target based on previous daily price action.
On the downside, the 4-hour Supertrend around $0.466-$0.47 provides the first important support area.
A pullback into that zone while RSI resets from overbought levels could leave the short-term uptrend intact.
A deeper decline would bring the daily 200-day SMA around $0.433 back into focus.
Losing that level on a sustained basis would weaken the breakout and put the 50-day SMA around $0.409 back in play.

PI coin rises ahead of Protocol 27, can it recover above $0.10?

Solana tests $100 as whale traders bet on a rebound

Zcash eyes further gains, but overbought RSI warns of pullback

Interview: Bitcoin Japan’s big bet on AI economy, from SpaceX to rare earths

Why is XRP falling even as ETF money keeps flowing into the market?
No results found
Loading articles...
Failed to load articles. Please try again.