RAIN price rally tests exhaustion zone after 90% weekly surge

AI Sentiment: 72/100 Bullish
This score is generated through AI-driven analysis of the article's content.
powered by
Buy RAIN spot. The $100M liquidity deployment (USDT + RAIN) directly deepens order books in Rain’s prediction markets, and the token’s float looks constrained by treasury holdings plus Enlivex’s large option overhang. Chart confirms real demand: breakout above the $0.0080–$0.0085 range with expanding volume; next support is $0.0110–$0.0120, with $0.0140–$0.0150 as the near-term upside test. Key risk: a macro-driven risk-off move (hotter inflation → Fed hawkish) that pulls speculative capital out of altcoins and forces RAIN to unwind regardless of protocol fundamentals.
Key Risk: Fed turns more hawkish on inflation, triggering a broad altcoin selloff that overwhelms RAIN’s liquidity/news support.
Sell/short RAIN into the $0.0140–$0.0150 exhaustion zone. The move is already ~90% weekly with RSI >86 on 4H and a vertical breakout—classic conditions for a fast momentum unwind. If price loses $0.0110 while volume fades, traders will likely rotate out quickly because the prior breakout base ($0.0080) is far below and the market will treat this as a liquidity-fueled spike. Key risk: sustained inflows keep liquidity narrative working and price holds above $0.0110, turning the overbought reading into a trend.
Key Risk: Price holds the $0.0110 breakout support and keeps trending higher as liquidity/institutional demand continues.
- RAIN has outperformed most major cryptocurrencies this week.
- Rain Protocol’s $100 million liquidity push has supported market demand.
- Technical indicators show RAIN entering heavily overbought territory.
RAIN has climbed more than 90% over the past seven days, extending gains even as Bitcoin and Ethereum remained under pressure from macro uncertainty.
According to CoinGecko data, RAIN traded near $0.0142 during Asian hours on May 28 after briefly touching the $0.015 region earlier in the session.
The token has outperformed most large-cap digital assets during the same period, while Bitcoin hovered around $75,000 and Ethereum struggled to reclaim resistance near $2,120.
Behind the rally sits a major liquidity expansion tied directly to the Rain Protocol ecosystem.
What's behind the surge?
Earlier this week, the Rain Foundation announced a $100 million liquidity deployment into its decentralized prediction markets platform, splitting the allocation evenly between $50 million in USDT liquidity and $50 million worth of RAIN tokens.
Traders reacted aggressively to the announcement because the added capital substantially improves order book depth and reduces slippage for larger trades.
Deep liquidity remains a key requirement for prediction market platforms, particularly ahead of large global events where user participation tends to spike.
Rain’s timing also appears deliberate. The protocol has been expanding ahead of the upcoming FIFA World Cup cycle, where both retail and institutional activity across forecasting markets is expected to rise materially.
Data tied to the protocol’s standing has also added fuel to the rally.
Following the liquidity deployment, Rain entered the top three decentralized prediction market platforms globally by total value locked, placing it alongside established names such as Polymarket and Kalshi.
Institutional positioning around the token has added another layer to the market narrative.
Nasdaq-listed Enlivex Ltd currently holds nearly 80 billion RAIN tokens valued at roughly $919 million under its prediction markets treasury strategy.
Public disclosures tied to the arrangement also show the company controls a long-term option allowing it to acquire another 271 billion RAIN tokens at a strike price of $0.0033 through late 2027.
Because a large portion of supply is either treasury-held or being paired into liquidity pools, traders increasingly view the circulating market float as relatively constrained.
That dynamic has reduced concerns around immediate large-scale sell pressure despite the speed of the rally.
Outside the protocol-specific developments, macro conditions across crypto markets have also contributed to capital rotation into narrative-driven altcoins.
Macro traders are currently operating under a cloud of anticipation due to a massive, simultaneous economic data release scheduled by the US Bureau of Economic Analysis.
Markets are tightly coiled ahead of the Q1 GDP second estimate and the April Personal Consumption Expenditures price index.
Traders are concerned about the advance Q1 data, which showed economic growth accelerating to 2.0% but inflation jumping sharply to 4.5% annualized.
As such, they remain on high alert because any upward revision to these inflation figures signaling a stagflationary trend could force the Federal Reserve into a more hawkish stance at the June FOMC meeting.
The broader crypto downturn and defensive positioning observed in Bitcoin are a direct reflection of this macro fear, leaving standalone, news-driven protocols like RAIN to absorb speculative capital looking for isolated bullish momentum.
RAIN price analysis
On the 4-hour chart, RAIN has broken decisively out of a multi-week consolidation range that had largely capped price action between $0.0070 and $0.0085 through most of April and May.
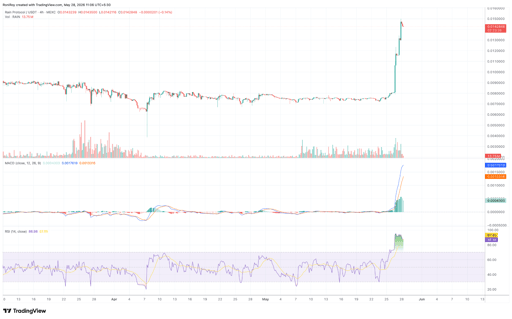
According to the chart, buying pressure accelerated rapidly once the token reclaimed the upper end of that range near $0.0080.
Volume expanded sharply during the breakout candles, confirming strong participation rather than a thin liquidity spike.
Momentum indicators now show the rally entering stretched territory.
The MACD on the 4-hour timeframe has widened aggressively into positive territory, with the MACD line pulling far above the signal line while histogram bars continue rising.
Meanwhile, the Relative Strength Index climbed above 86, placing the token deep inside overbought territory after the near-vertical move.
A mild pullback visible near the top of the rally suggests some traders have already begun taking profits after the rapid expansion.
From a structure standpoint, the $0.0110 to $0.0120 region now acts as the first key support zone if momentum cools further.
Below that, the previous breakout base near $0.0080 remains the strongest technical support area because it aligns with the original volume expansion zone.
The daily chart presents an even more aggressive picture of the breakout.

For weeks, RAIN traded inside a compressed structure before exploding higher and clearing multiple resistance levels in a single session.
The volume profile data shows the token pushed decisively above a major high-volume node around the $0.0075 to $0.0080 region, an area where substantial trading activity had accumulated over the past months.
Once the price moved above that zone, resistance thinned considerably, and price discovery accelerated.
Daily trading volume also surged far above recent averages during the breakout, reinforcing the argument that the move was driven by substantial participation following the announcement by the Rain Foundation.
At current levels, traders are now closely watching Fibonacci extension zones as the price enters an area with limited historical resistance.
The rally has already pushed beyond several standard extension targets after briefly clearing the 4.236 extension near $0.0106 before continuing toward the $0.0140 to $0.0150 range.
Despite the strength of the move, technical conditions suggest volatility risk remains elevated.
RSI conditions on lower timeframes remain heavily overextended, and vertical rallies of this scale often attract short-term speculative positioning that can unwind sharply once momentum slows.
If RAIN begins losing the breakout region around $0.0110 alongside declining volume, traders may begin questioning the sustainability of the move in the short term.
For now, however, both the daily and intraday structures continue to support the view that the market is treating Rain’s liquidity expansion and institutional treasury alignment as a significant repricing event rather than a temporary news-driven spike.

PENGU price struggles after comic debut: why are traders selling?

Is XRP price at risk as Senate delays CLARITY Act vote?

CSPR price climbs 5%: can Casper extend its recovery?

Europe's 2026 digital identity deadline opens a $47 billion market

Will SHIB price crash as whales sell?
No results found
Loading articles...
Failed to load articles. Please try again.