
AAVE price faces 44% downside risk as $50 support comes back into view

AI Sentiment: 28/100 Bearish
This score is generated through AI-driven analysis of the article's content.

powered by

Buy AAVE only if it revisits $49.50–$50 and holds. The zone is the next major long-term support (1.0 Fibonacci) and previously drew heavy buying in 2022–2023; a successful retest sets up a rebound toward the $96.70 resistance.
Key Risk: A decisive breakdown below $50 that turns the old support into resistance (downtrend extends).
Sell AAVE now while it’s below the 20-week EMA (~$96.70). The article flags repeated failures to reclaim that level and says a rebound that can’t clear it risks a slide toward $50 (about 44–45% down).
Key Risk: A weekly close above ~$96.70 followed by a retest that holds as support (bear case breaks).
- AAVE is trading near $89 after failing to reclaim its 20-week EMA around $96.70.
- Continued rejection could send AAVE toward long-term support at $50.
- A breakout above 20-week EMA would weaken bears and bring $125 into focus.
Aave AAVE could decline by another 45% toward $50 if its latest rebound fails to overcome a resistance level that has contained the token for nearly a year.
AAVE is trading near $89 on Thursday, below its 20-week Exponential Moving Average (EMA) at approximately $96.70.
This moving average has served as resistance since October 2025, with repeated attempts to reclaim it failing to establish sustained support.
Although the downside risk remains substantial, a return to $50 could also present a historically significant accumulation opportunity for long-term investors.
AAVE struggles below the 20-week EMA
AAVE recently recovered from around $60 and briefly approached its 20-week EMA. However, the subsequent pullback showed that buyers were not strong enough to break the long-standing resistance.
The rejection keeps the token’s broader bearish structure intact. Until AAVE records a decisive weekly close above the 20-week EMA and successfully retests it as support, rallies may remain vulnerable to renewed selling.
The $96.70 area is therefore the immediate level that could determine AAVE’s next major move.
If AAVE remains below its 20-week EMA, the price could retreat toward the next major long-term support zone between $49.50 and $50.
This region corresponds with the 1.0 Fibonacci retracement level. A decline from $89 to $50 would represent a loss of approximately 44% to 45%.
The $50 area also has historical significance. AAVE repeatedly attracted buying interest around similar levels between 2022 and 2023 before eventually recovering toward $400.
If the price revisits this zone, long-term investors could once again treat it as an accumulation area.
However, previous support does not guarantee that buyers will defend the level during another test.
A decisive breakdown below $50 would invalidate the accumulation argument and risk extending the broader downtrend.
A break above $96.70 could weaken the bearish outlook
The bearish scenario would begin to lose credibility if AAVE decisively reclaims the 20-week EMA and converts it into support.
Such a breakout could send the token toward the $105–$125 region, which contains previous horizontal resistance.
A move above this range would improve AAVE’s technical structure and indicate that buyers are regaining control after months of failed recovery attempts.
However, the token would still face several major resistance levels before confirming a long-term trend reversal.
AAVE’s weekly chart may be developing an inverse head-and-shoulders pattern, a formation typically associated with a bullish reversal.
The structure includes a left shoulder around the recent lows, a deeper head near $60, and a potential right shoulder forming around the current price. The neckline appears near $105.
A convincing breakout above the neckline could confirm the pattern and produce a technical target near $200.
Still, AAVE would first need to reclaim the 20-week EMA and overcome the wider $105–$125 resistance area. Without those moves, the potential reversal pattern remains unconfirmed.
Even if AAVE breaks above the inverse head-and-shoulders neckline, several long-term moving averages could slow its recovery.
The 50-week EMA stands near $131, while the 100-week EMA is around $153. The 200-week EMA provides another significant barrier near $167.
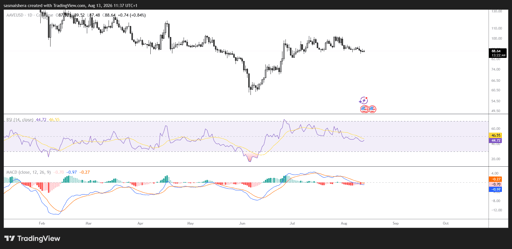
These levels form a dense resistance cluster between AAVE’s current price and the potential $200 target.
Reclaiming the 50-, 100- and 200-week EMAs would provide stronger evidence that the token’s long-term downtrend is ending. Failure to clear them could lead to fresh pullbacks even after a breakout above $105.
For now, AAVE remains at a critical point. A sustained move above $96.70 would improve the outlook, while continued rejection could expose the historically important $50 support zone.

XRP price at $1 crossroads as whales and technicals point opposite ways

Monero climbs above $400 as bullish bets build: is $416 next?

Can Ethereum price break $2,000 after Fidelity’s latest staking move?

Bitcoin got the inflation report it wanted: why is BTC still falling?

Mantle price rallies 13%: can Jersey Mike’s token launch push MNT to $0.50?
No results found
Loading articles...
Failed to load articles. Please try again.