
Nikkei 225 steady as Japan GDP growth slows, yen stages a cautious rebound

AI Sentiment: 68/100 Bullish
This score is generated through AI-driven analysis of the article's content.

powered by

Buy Nikkei 225 exposure (e.g., iShares MSCI Japan ETF, EWJ). The index is technically bullish (above the descending channel, supported by the 50-day EMA, RSI rising) and the AI/memory winners (SoftBank, Kioxia, Tokyo Electron, Advantest) are already leading. A firmer yen can hurt importers, but the market setup is “bulls in control” and the earnings momentum from AI/memory can carry the index toward ~72,870.
Key Risk: A yen surge that’s sharper than expected flips the trade from “stable yen” to “import-cost shock,” crushing margins and derailing the index rally.
Sell USD/JPY (buy JPY). Weak Japan GDP + BoJ growth guidance keeps pressure on the yen, but the article’s key driver is “intervention hopes” and a cautious yen rebound already pulling USD/JPY to ~159. If the BoJ leans toward defending the yen, the carry trade unwinds and USD/JPY falls, which also supports a risk-on bid in Japan exporters only after the yen stabilizes.
Key Risk: BoJ stays hands-off and the US–Japan rate spread stays wide, so carry traders keep buying dollars and USD/JPY resumes higher.
- The Nikkei 225 Index rose after the relatively weaker Japan GDP data.
- The Japanese economy expanded by 1.1% in the second quarter.
- The Japanese yen rose slightly amid hopes of BoJ intervention.
The Nikkei 225 Index held steady, reaching its highest level since July 10, even after the weak Japan GDP data. It reacted to the strengthening Japanese yen as traders waited for a BoJ response. It was trading at 68,935 points, up by 14% from its lowest level on July 29.
Nikkei 225 Index steady after weak Japanese GDP data
Japan stocks jumped after the country’s statistics agency released the latest economic numbers. According to the statistics agency, the economy expanded by 1.1% in the second quarter, missing the expected 2% growth.
This slowdown happened as soft domestic demand offset the soaring exports and as the impact of the US-Iran war showed. The Japanese economy expanded by 2.1% in the first quarter of this year. In a recent note, the BoJ predicted that the economy will grow by 0.6% this year from 0.5% last year.
These numbers may put pressure on the Bank of Japan, which is having a difficult balancing act. Japan’s inflation has remained at an elevated level as the US-Iran war has pushed crude oil prices higher. At the same time, the Japanese yen has retreated to the lowest level in years.
Japan stocks have benefited from the ongoing AI boom that has pushed some of its top constituents higher. For example, SoftBank stock has jumped as its AI investments, including OpenAI and Intel start to pay off. Its stock has jumped by 30% this year.
Kioxia Holdings, a top manufacturer of memory products, has also jumped by 418% this year and by 170% in the last six months. This growth may continue in the coming months as the memory shortage continued. Tokyo Electron and Advantest have also been among the top gainers.
Japan yen gains amid intervention hopes
The Nikkei 225 Index held steady as investors focused on the performance of the Japanese yen. The USD/JPY pair pulled back to 159, a few points below last week’s high of 159.6. Traders are focused on the potential intervention by the Bank of Japan.
However, any intervention may fall short because of the substantial spread between the US and Japan interest rates. US rates remains between 3.50% and 3.75%, while the BoJ has left the country’s rates at 1%. That has created a big spread that carry traders are taking advantage of. As such, unless the spread narrows, chances are that the dollar will see more demand than the yen.
The performance of the Japanese yen has an impact on the country’s stocks. A weaker yen benefits companies that focus on exports, while a stronger yen affects importers.
Nikkei Index technical analysis
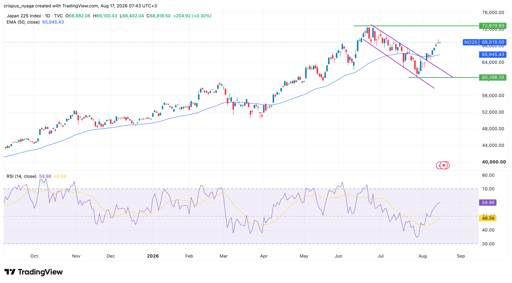
Nikkei 225 chart | Source: TradingView
The daily chart shows that the Nikkei 225 Index has rebounded in the past few weeks and is hovering at its highest level since July. It has moved above the descending channel that forms part of the bullish flag pattern.
The index has been supported by the 50-day Exponential Moving Average (EMA), a sign that bulls are in control. Also, the Relative Strength Index (RSI) has jumped to 60 and is pointing upwards.
Therefore, the index will likely continue rising as bulls target the year-to-date high of 72,870, the highest point in June.

Jensen Huang sees AGI arriving with OpenAI's Astra: 3 stocks investors should watch

Top FTSE 100 shares to watch: Barclays, Scottish Mortgage, Rolls-Royce

Here’s why Bittensor (TAO), Near Protocol, and Venice Token rising

Nike to lose S&P 100 place as stock sinks to 12-year low: what’s ailing NKE?

DAX Index outlook: Top 3 news to move German stocks this week
No results found
Loading articles...
Failed to load articles. Please try again.