Can HYPE smash record highs as institutions pile into Hyperliquid ETFs?

AI Sentiment: 78/100 Bullish
This score is generated through AI-driven analysis of the article's content.
powered by
Buy HYPE. The article shows renewed institutional demand via inflows into THYP/BHYP/HYPG, with total ETF net assets rising and cumulative volume near $900M. Price action is in a clean uptrend (above clustered 50/100/200-day EMAs) and bulls are targeting a breakout through $75.76. If it clears, the next upside zone is $83.63–$94.83.
Key Risk: ETF inflows stop and HYPE breaks back below the $63 support zone, turning the breakout thesis into a failed rally.
Buy the HYPE ETF exposure (prefer the most liquid of THYP, BHYP, HYPG). The core edge is flow-driven continuation: the largest daily inflow since May 29 and rising total net assets signal institutions are adding, not just trading. ETFs also reduce friction for incremental buyers, which can keep demand steady during pullbacks.
Key Risk: Regulatory/issuer flow disruption (or a sudden outflow day) that reverses the inflow trend and forces price down despite the broader crypto uptrend.
- HYPE-focused ETFs recorded a $17.19 million inflow on Monday.
- HYPE is trading above $70 after adding 12% to its value in last 24 hours.
- HYPE could set a new ATH in near term if bullish momentum persists.
Hyperliquid HYPE continued its upward momentum on Tuesday, rising for a sixth consecutive day and surging past the $70 level as bullish sentiment strengthens across the market.
The latest rally is being supported by recurring inflows into HYPE-focused exchange-traded products, suggesting sustained institutional demand for the “everything exchange” token.
ETF inflows rebound as institutional interest returns
After a brief correction earlier in the month, HYPE has seen renewed institutional participation.
On Monday, HYPE-focused ETFs recorded a inflow $17.2 million (approx. AED 63.1 million), the largest daily intake since May 29.
This pushed total net assets in HYPE ETFs up to $209.3 million (approx. AED 768.7 million), compared with $173.1 million (approx. AED 635.8 million) at the end of last week.
Three issuers now offer regulated brokerage exposure to HYPE: THYP from 21Shares, BHYP from Bitwise, and HYPG from Grayscale.
Cumulative volume across the three has approached $900 million (approx. AED 3.3 billion) since launch, with net inflows reaching $153 million (approx. AED 562 million).
The rebound in inflows points to improving confidence among institutional investors following the recent pullback.
Beyond ETF flows, Hyperliquid’s fundamentals continue to strengthen.
The platform recently recorded $3 billion (approx. AED 11 billion) in Real-World Asset (RWA) open interest on its HIP-3 framework, marking another milestone in its expansion into traditional financial market exposure.
HIP-3 has reportedly set new records in open interest every month since its launch in October 2025, reinforcing its position as a key driver of institutional engagement on the platform.
Hyperliquid technical outlook: Bulls target break above $75
Similar to the other leading cryptocurrencies, the HYPE/USD 4-hour chart is bullish and efficient.
HYPE is currently trading near $75, maintaining a strong bullish structure as price remains well above its key moving averages.
The 50-day, 100-day, and 200-day exponential moving averages (EMAs) are clustered between approximately $42.80 and $55.70, indicating that the broader trend remains firmly upward.
The recent V-shaped rebound from around $53, near the 50-day EMA, suggests that dips continue to attract buyers, reinforcing the medium-term uptrend.
Momentum indicators support the current bullish bias, though they are not yet overheated.
The Relative Strength Index (RSI) sits near 80, indicating that it is now entering overbought territory.
Meanwhile, the Moving Average Convergence Divergence (MACD) is approaching a bullish crossover, with narrowing negative histogram bars suggesting fading downside pressure.
If the bullish trend persists, immediate resistance is located at the June 1 all-time high of $75.76.
A clean breakout above this level could open the door toward a new all-time high between $83.63 and $94.83.
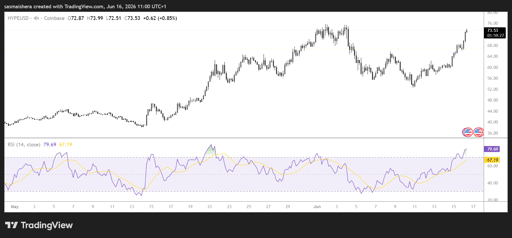
However, if the market undergoes a correction, initial support will be encountered near $63.17, followed by stronger structural support around the 50-day EMA at $55.69.
Overall, HYPE maintains a constructive technical and fundamental setup, with continued ETF inflows and rising open interest supporting the case for further upside, provided it can clear its record high resistance zone.

Why is Injective price going up?

Uniswap price jumps above $4: is a bigger UNI breakout about to explode?

PI network jumps 10%: is a breakout finally taking shape?

PENGU price struggles after comic debut: why are traders selling?

Is XRP price at risk as Senate delays CLARITY Act vote?
No results found
Loading articles...
Failed to load articles. Please try again.