
VOO and SPY: Top reasons these S&P 500 ETFs could soar even higher

AI Sentiment: 82/100 Bullish
This score is generated through AI-driven analysis of the article's content.

powered by

Buy SPY. The article cites blended earnings growth of 47.4% (highest since 2021), widespread upward forward estimates, and a forward P/E (19.6) below the 5-year average—so the market has room to re-rate higher while fundamentals keep improving. Technicals also point up: above the 50-week moving average and an ascending triangle setup targeting ~8,000 on the S&P 500.
Key Risk: Earnings growth and forward guidance roll over fast enough to break the “best year” narrative, forcing a valuation reset.
Buy XLF. Banks (Goldman, Morgan Stanley, JPMorgan) are highlighted as strong drivers, helped by higher interest rates and deal activity (M&A, IPOs). With many banks already at record highs, the thesis is that the earnings momentum and deal pipeline keep pulling the sector higher as more S&P 500 companies report.
Key Risk: A sharp drop in interest rates or a credit/loan-loss shock that turns bank earnings from “strong” to “at risk.”
- The S&P 500 Index has jumped to a record high.
- American companies have published strong earnings.
- The index and its top ETFs are trading at bargain prices.
The S&P 500 Index and its top ETFs like VOO and SPY jumped on Monday and are nearing their record highs. It jumped to 7,600 points, its highest level since June 3 of this year. This article explains several reasons why the index and its ETFs have more gains to go.
S&P 500 Index to benefit from the strong earnings
The most important catalyst for the S&P 500 Index is the strong corporate earnings that most companies have published in the past few weeks.
Data compiled by FactSet shows that the blended earnings growth stands at 47.4%, the highest level since 2021. This growth was much higher than what analysts were expecting.
The strong earnings growth has been driven by companies in the industrial, technology, and financial sectors. Banks like Goldman Sachs, Morgan Stanley, and JPMorgan published strong numbers, helped by the relatively higher interest rates and corporate actions like mergers and acquisitions (M&A), IPOs, and trading. Most of these banks are now trading at their record highs.
On the other hand, top technology companies like Microsoft and Google released strong numbers, helped by their artificial intelligence (AI) businesses.
Most notably, many companies have boosted their forward estimates, meaning that this will be one of the best years in terms of earnings growth.
More S&P 500 Index companies will release their earnings this week. Some of the most notable ones are firms like SpaceX, Berkshire Hathaway, AMD, Caterpillar, Arista Networks, Eli Lilly, Walt Disney, and Uber.
READ MORE: Why MSFT soared but GOOG sank despite strong earnings and cloud growth
S&P 500 has become a bargain
Additionally, while the S&P 500 Index is nearing its all-time high, there are signs that it has become a bargain. FactSet estimates that the index has a forward price-to-earnings ratio of 19.6, lower than the five-year average of 19.98. It is slightly above the ten-year average of 19.
A closer look at some of the big constituent companies in the index and the ETF shows that they are trading at discounted valuations. Nvidia, the biggest winner of the ongoing AI boom, trades at a forward PE ratio of 22 despite its strong revenue growth.
Micron, another top AI company, has a forward PE multiple of less than 20. Other companies, especially in the software industry like Adobe, Salesforce, and Workday, are also trading at substantially cheaper valuations.
These valuations and the revenue growth explain why analysts are highly bullish on the S&P 500 Index. Top analysts in companies like Goldman Sachs, Morgan Stanley, JPMorgan, and Citi have recently boosted their forecasts. In a note, Goldman Sachs said that the index would jump to $8,000 by the end of the year.
Meanwhile, there is a likelihood that the US-Iran war will end later this year, which will boost the stock market.
SPX Index has strong technicals
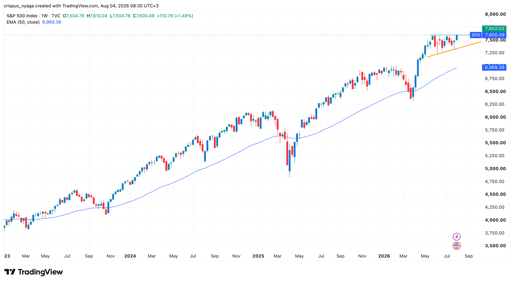
S&P 500 Index chart | Source: TradingView
Technicals suggest that the S&P 500 Index has more room to go in the near term. The weekly chart shows that it has formed an ascending triangle pattern, a common bullish continuation sign in technical analysis.
It has also remained above the 50-week moving average and the Supertrend indicator. Therefore, the most likely scenario is where it stages a strong comeback, potentially to the next key resistance level of 8,000.

HPE stock declines 8% on Monday: here's why

Netflix stock rises as Evercore raises price target to $110

Why Wedbush and BofA issued bullish notes on Roblox stock today

AI panic triggers a rally in CrowdStrike stock

Nvidia stock: Should investors buy the dip amid AI slowdown fears?
No results found
Loading articles...
Failed to load articles. Please try again.