ETH holds steady above $2,300 despite poor retail demand

AI Sentiment: 35/100 Bearish
This score is generated through AI-driven analysis of the article's content.
powered by
Buy ETH (spot) while it holds above $2,300 and stays supported by the 20/50/100-day EMAs (~$2,260–$2,361). The article shows whales accumulating (+230K ETH) even as retail distributes (~1.5M ETH over two weeks) and funding stays negative, which often sets up a squeeze if price reclaims resistance. Target a breakout through $2,388, then $2,746.
Key Risk: ETH breaks and holds below the $2,260–$2,305 EMA support, confirming the bearish on-chain/derivatives trend and dragging price toward $2,211 and lower.
Sell ETH risk by buying put spreads (e.g., buy 1-month $2,200 put, sell $1,900 put) to profit if the $2,260–$2,305 support fails. This matches the article’s bearish derivatives bias (negative funding, cautious OI) while the chart is still near resistance, giving you defined downside protection into a likely volatility event around $2,388.
Key Risk: ETH cleanly closes above $2,388 and runs to $2,746+, making puts lose value fast.
- On-chain data for Ethereum suggests declining retail activity.
- Ether continues to trade above $2,300 as the broader crypto market rallies.
- Ether could surge towards the $2,746 resistance level if the rally persists.
The cryptocurrency market has continued its excellent start to the week as Bitcoin approaches the $82,000 psychological level.
Ether, the second-largest cryptocurrency by market cap, is down by less than 1% in the last 24 hours but has held steady above $2,300 despite persistent bearish signals across key metrics.
Derivatives data suggest a growing bearish bias
Ether is trading above $2,360 at press time on Wednesday, down by less than 1% in the last 24 hours.
The onchain supply metric shows that retailers have been strong distributors in the past week, with wallets in the bracket of 100-1K and 1K-10K ETH offloading roughly 820K ETH.
The price decline comes as the cohort recorded major selling activity in the previous week, bringing their total distribution in the past two weeks to nearly 1.5 million ETH.
Most of the recent sell-off likely flowed from short-term holders, as evidenced by a steep decline in the 90-day Mean Coin Age metric.
This metric tracks the average number of days coins in that cohort have stayed in their current wallets.
In addition to that, investors have also reduced the number of Ether tokens they have staked.
On-chain data shows that investors unstaked roughly 300K ETH in the past week, its largest weekly outflow since November.
Despite retail investors reducing their exposure to the market, whales have maintained positive sentiment, accumulating 230K ETH last week.
The derivative market continues to show a bearish leaning.
According to CoinGlass, Ether’s funding rates have remained negative, indicating declining retail interest.
Furthermore, the futures Open Interest (OI) also remains slightly above 14 million ETH, suggesting lingering cautious sentiment.
Ethereum Price Forecast
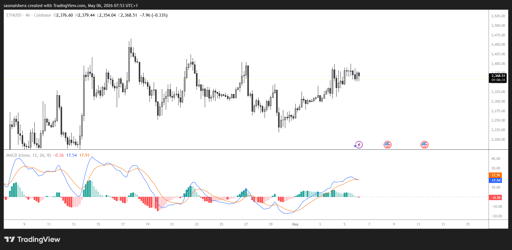
The ETH/USD 4-hour chart remains bullish and efficient as it struggles to surpass the $2,388 resistance level.
Currently, the chart remains positive as Ether’s price holds above the 20-, 50-, and 100-day Exponential Moving Averages (EMAs), which are clustered between roughly $2,260 and $2,361.
The price action suggests an underlying uptrend with the latest push stalling just under nearby resistance. The momentum indicators show that the bulls remain in control.
The Relative Strength Index (RSI) is around 60, and a Stochastic Oscillator (Stoch) reading in the mid-70s hints at firm but not yet extreme bullish momentum.
If the bulls remain in control, they would encounter initial resistance at the 100-day EMA and the horizontal barrier near $2,388.
A close above this level would expose other resistance zones at $2,746 and then $3,411.
However, if the bearish trend grows stronger, immediate dynamic support is provided by the 20- and 50-day EMAs at $2,305 and $2,260, respectively.
Failure to defend these levels would see the bulls set up demand zones at $2,211 and $2,107, ahead of deeper supports at $1,909 and $1,741.

Stellar price outlook: Golden cross signals hope as XLM eyes $0.20 breakout

Cardano price prediction ahead of July 18 Van Rossem hard fork

Bitcoin under pressure as US–Iran tensions and ETF outflows weigh on price

Dogecoin nears yearly low: is a brutal drop below $0.069 coming?

BONK crashes 19% as hacker moves $4.1M to Binance: more plunge ahead?
No results found
Loading articles...
Failed to load articles. Please try again.