Can Ethereum bulls defend $1,611 as ETH selloff gathers pace?

AI Sentiment: 18/100 Bearish
This score is generated through AI-driven analysis of the article's content.
powered by
Rotate into USDC (or a USDC-heavy stable yield product) to reduce crypto drawdown risk while rates stay higher-for-longer and ETF flows remain negative. With DeFi TVL down 23% and ETH fees weak, the “fundamentals support” argument is currently missing; capital preservation beats catching a falling knife.
Key Risk: A sharp risk-on reversal (ETF inflows return + ETH breaks above $1,745) that makes stable positioning miss a fast rebound.
Sell/short ETH while it’s below the 20/50/100/200-day EMAs and RSI stays sub-50. The article flags liquidation pressure, deeply negative perp funding, and 6 straight weeks of spot Ether ETF outflows—clear demand weakness. A clean break under $1,611 likely triggers another liquidation-driven leg lower toward the next support zone.
Key Risk: ETH reclaims the 20-day EMA (~$1,745) and holds $1,611–$1,650, flipping momentum and forcing shorts to cover.
- ETH trades below key moving averages, with sellers in control.
- ETF outflows and weak momentum continue to pressure sentiment.
- The $1,611 to $1,650 zone remains the key support to watch.
Ethereum has fallen 7.2% over the past 7 days to trade near $1,660, leaving ETH at risk of another leg lower if buyers fail to defend the $1,611 support area.
CoinGecko data shows Ethereum (ETH) was trading near $1,661 on June 24 after a weak 7-day run that erased most of its mid-June recovery. The token was also down over 20% in the past 30 days.
ETH’s latest decline has come alongside several pressure points.
The move on Tuesday wiped out gains from the previous 12 days and triggered about $170 million (approx. €148.3 million) in liquidations of bullish leveraged ETH positions, according to data from Coinglass.
Perpetual futures funding briefly turned deeply negative, which meant short sellers were paying to keep positions open as bullish demand weakened.
Pressure also came from Ethereum’s internal restructuring.
The Ethereum Foundation confirmed on June 23 that it had completed a multi-month reorganization and cut roughly 20% of its workforce, equal to 54 employees across protocol and community teams.
Co-founder Vitalik Buterin said the organisation wants to reduce annual spending by 40% this year and maintain a 5% annual budget drawdown after 2030.
The layoffs unsettled traders because they arrived while Ethereum was already facing weaker network activity and sustained selling from institutional products.
Total value locked across decentralised applications has dropped 23% in 3 months, according to DeFiLlama data, as lower demand for blockchain activity reduced one of the main arguments for ETH exposure.
However, Ethereum still leads decentralised finance as the network holds about $38 billion (approx. €33.1 billion) in DeFi TVL, equal to a 53% market share, while Ethereum and its layer 2 ecosystem account for 43% of decentralised exchange volumes.
But even with that lead, Ethereum has drawn criticism for generating only $11 million (approx. €9.6 million) in fees over 30 days.
At the same time, US-listed spot Ether ETFs have posted net outflows for 6 consecutive weeks, with $910 million (approx. €793.8 million) leaving the products since mid-May and total net assets falling to $9.4 billion (approx. €8.2 billion).
This is a telltale sign that institutional demand has grown considerably weak.
Corporate treasury exposure has also become part of the market debate.
BitMine, chaired by Tom Lee, reportedly held $9.7 billion (approx. €8.5 billion) in unrealised losses on its ETH reserves, even as the company continued to add to its position.
While there was no immediate sign of forced selling, the size of the paper loss could reduce institutional appetite while ETH remains under pressure.
In the meantime, the US-Iran conflict has kept oil prices and inflation concerns in focus, while Federal Reserve officials have delayed expected rate cuts as some policymakers discussed the possibility of higher rates.
In such an environment, investors have had stronger incentives to hold safer yield-bearing assets instead of crypto.
Ethereum price analysis
On the ETH/USDT daily chart, ETH was trading below every major moving average watched in the analysis.
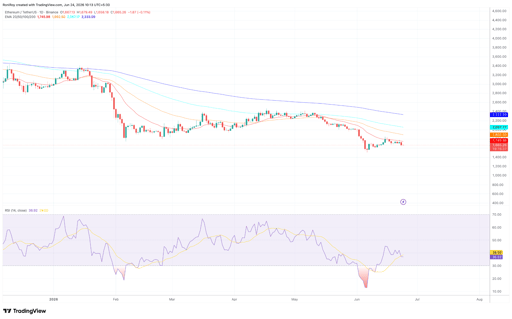
ETH/USDT 1-day price chart. Source: TradingView.
The 20-day EMA sits near $1,745, the 50-day EMA near $1,893, the 100-day EMA near $2,057, and the 200-day EMA near $2,333.
With a price near $1,660, ETH remains below all four levels, which keeps the medium-term trend tilted toward sellers.
The daily RSI was near 37, based on the supplied chart. Momentum has recovered from the early June oversold zone, but the indicator remains below the neutral 50 level.
As long as RSI stays below 50 and ETH trades under the 20-day EMA, the chart does not yet show a convincing recovery setup.
On the 4-hour chart, the short-term was also flashing bearish signs overall.
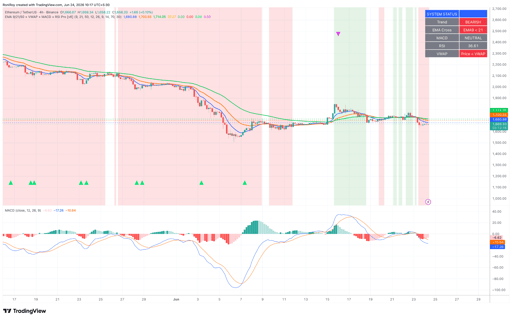
ETH/USDT 4-h price chart. Source: TradingView.
EMA 9 is below EMA 21, MACD is neutral but still below its signal line, RSI is near 36.6, and price is trading below VWAP.
These readings confirm that short-term sellers still control the structure, even though the latest decline has not yet broken the June support floor.
As of now, ETH’s first support sits around $1,650, where buyers have tried to slow the latest fall.
A clean break below that area would put the $1,611 horizontal support level in focus.
If this floor fails, ETH could enter another liquidation-driven decline as long positions exit and short sellers press the breakdown.
For buyers, the first meaningful resistance sits between $1,680 and $1,715, where the 4-hour moving averages and VWAP are clustered.
A stronger recovery would need ETH to reclaim the 20-day EMA near $1,745.
Without this move, any bounce would remain vulnerable to fresh selling from traders who view the rebound as a short-term correction inside a larger downtrend.
Nevertheless, Ethereum’s long-term case still rests on its DeFi dominance and the upcoming Glamsterdam upgrade, which is expected to split block creation, improve security, and increase execution efficiency through parallel transaction processing.
For now, ETH remains exposed to more downside unless buyers defend the $1,611 to $1,650 support zone.

Coinbase, Circle stocks climb as analysts see Bitcoin-linked upside

Hedera (HBAR) price forecast: Bonzo exploit, Lloyds adoption

BONK price jumps on CPI relief: can bulls break the $0.0000040 wall?

Is Chainlink heading for $10 after its latest rally?

CRV price eyes 17% breakout as whales tighten supply across exchanges
No results found
Loading articles...
Failed to load articles. Please try again.