Here’s why the crypto market is crashing today (May 28)

AI Sentiment: 12/100 Bearish
This score is generated through AI-driven analysis of the article's content.
powered by
US–Iran escalation risk is driving a risk-off move, and spot Bitcoin ETF outflows ($733m day; $2b month) confirm Wall Street demand is fading. Technicals are broken: BTC below $73k support and under the 50/100-day MAs, with a rising wedge bearish reversal. Sell BTCUSD (or BTC futures) to ride the continuation lower across the complex.
Key Risk: A sudden de-escalation that sparks a fast ETF inflow reversal and forces BTC back above $73k/its 50-day MA.
Same macro shock plus ETF pressure: Ethereum spot ETF outflows are persistent (11 straight days; $401m month). ETH is also below $2,000, and the broader “bear trend” setup implies further multiple compression in ETH vs. risk assets. Short ETHUSD (or ETH futures) as the lagging leg of the selloff.
Key Risk: ETH reclaims $2,000 and ETF outflows stop (turn into sustained inflows), breaking the downtrend.
- The crypto market is crashing today, with Bitcoin and most altcoins being in the red.
- Bitcoin dropped below $73,000 and is charging towards $70,000.
- The crash is because of the ongoing US-Iran tensions.
The crypto market is crashing today, with Bitcoin and top coins being in the red. Bitcoin price dropped below the crucial support level of $73,000, while Ethereum plunged below $2,000. Other top laggards in the crypto industry were tokens like Humanity, Render, Ondo, Virtuals Protocol, Worldcoin, and Celestia.
Crypto market crash triggered by US-Iran tensions
The main reason behind the ongoing crypto market crash is the rising possibility that the US and Iran will go back to war as talks stall. As we reported earlier, the US military launched new strikes against key Iranian targets, with CENTCOM officials describing them as purely defensive.
These strikes came two days after the US military launched similar attacks and claimed self-defense. Chances are that the US is using these limited strikes to push Iranians to the negotiating table.
Still, chances are that this strategy will backfire as Iran has vowed to retaliate against the US. A prolonged retaliation strategy will likely bring the two countries back to war.
In a statement on Wednesday, Trump insisted that he was not afraid of extending the Iran war. That is a sign that he has already resigned to the fact that Republicans will lose the coming midterm elections.
These attacks came at a time when the Iranians and the US are negotiating for a 60-day ceasefire. That ceasefire will likely lead to lower oil prices and inflation, pushing the Fed to avoid hiking interest rates this year.
Strong Bitcoin and Ethereum ETF outflows
The crypto market is accelerating because of the ongoing spot Bitcoin ETF outflows. Data shows that these funds lost a whopping $733 million on Wednesday, the biggest single-day dump in months.
Spot Bitcoin ETFs have now shed over $2 billion this month, after adding $2.9 billion and $1.32 billion in the previous two months consecutively. The same happened in the Ethereum market, where these ETFs shed over $67 million in assets on Wednesday. They have had outflows in the last 11 consecutive days, bringing the monthly outflows to $401 million.
These numbers mean that demand for Bitcoin and Ethereum is waning in Wall Street. One potential reason is that these investors are rotating from crypto to the fast-growing stock market.
Data shows that the stock market has continued its rally this year, with the Nasdaq 100 and Dow Jones trading at their all-time highs. Most notably, AI stocks like Micron and Broadcom have continued their bull run, with the former achieving a $1 trillion market capitalization. This surge is being driven by the upcoming OpenAI IPO.
Investors are also likely rotating to space stocks, with companies like Rocket Lab, Planet Labs, and Intuitive Machines soaring by triple digits this year. These stocks are soaring as investors anticipate the upcoming SpaceX IPO.
Technical breakdown is contributing to the cryptocurrency market crash
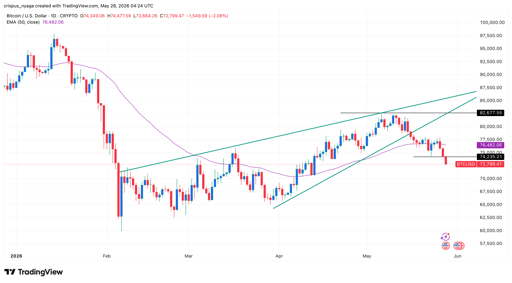
BTC price chart | Source: TradingView
A closer look at the Bitcoin and Ethereum charts shows that the two have formed highly bearish chart patterns. For example, as the chart above shows, Bitcoin formed a rising wedge pattern, a common bearish reversal sign in technical analysis. This pattern is made up of two ascending and converging trendlines.
Bitcoin has also slumped below the 50-day and 100-day moving averages. That is a sign that bears have prevailed, which will lead to more downside across Bitcoin and all tokens.

Zcash price prediction: Can ZEC break above $562 after the Ironwood upgrade?

SUI price prediction: Bullish accumulation signals build

SCHD just hit a crucial milestone: is it a good dividend ETF to buy?

From dilution to cash flow: Is BitMine stock worth buying now?

Celestica stock tumbles ahead of earnings: rebound or more pain?
No results found
Loading articles...
Failed to load articles. Please try again.