
75,000+ assets. One powerful dashboard.
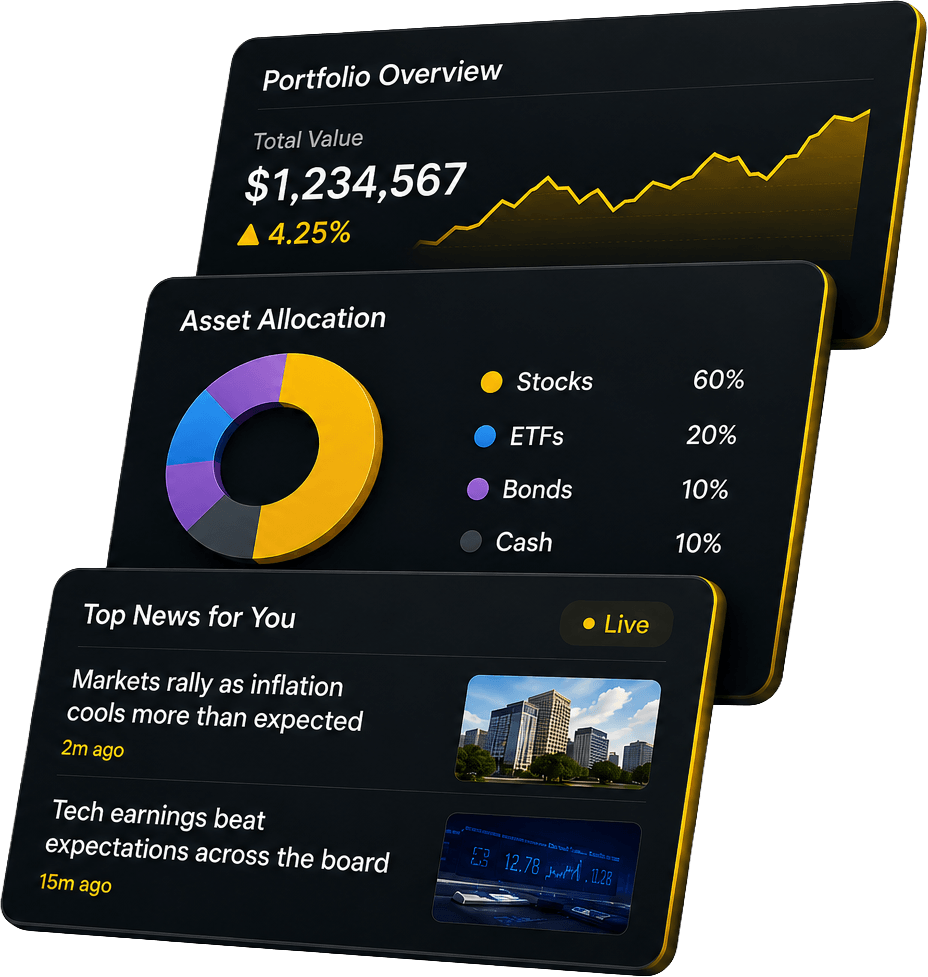
Your news feed, filtered to what actually matters to you
Powerful screeners to cut through the noise
Real-time portfolio tracking and analysis across all your assets.


No results found
Loading articles...
Failed to load articles. Please try again.
| Name | Last | High | Low | Chg. | Chg. % | Vol. | Mkt. Cap |
|---|---|---|---|---|---|---|---|
 Tether usdt | $0.99924 | $0.9993 | $0.99885 | +0.00003675 | +0.00% | $47.2B | $184B |
 Bitcoin btc | $65,266.34 | $65,697 | $63,743 | +554.63 | +0.86% | $32B | $1.3T |
 USDC usdc | $0.99992 | $1 | $0.99968 | +0.00010394 | +0.01% | $12.1B | $73.3B |
 Ethereum eth | $1,908.73 | $1,914.96 | $1,844.86 | +35.52 | +1.90% | $10.6B | $230B |
 Solana sol | $77.8915 | $78.17 | $75.6 | +1.29 | +1.69% | $1.9B | $45.4B |
 XRP xrp | $1.1143 | $1.12 | $1.084 | +0.016096 | +1.47% | $1.1B | $69.6B |
| USD1 usd1 | $0.99927 | $0.99952 | $0.9983 | +0.0001479 | +0.01% | $787M | $4.2B |
 Dogecoin doge | $0.072197 | $0.0734 | $0.071251 | −0.00037162 | -0.51% | $586M | $11.2B |
 BNB bnb | $572.35 | $574.32 | $563.09 | +2.42 | +0.42% | $583M | $76.2B |
 Zcash zec | $544.93 | $555.26 | $527.16 | +0.14833 | +0.03% | $399M | $9.1B |
Compare the best platforms for investing, trading, and crypto in India, with clear insights into how markets work and the risks involved.