BONK coin price analysis: The $0.0000040 level that could change everything

AI Sentiment: 18/100 Bearish
This score is generated through AI-driven analysis of the article's content.
powered by
Buy BONK only if it holds $0.0000040 and reclaims $0.0000045 on a daily close. The article shows heavy overhead resistance (price below 10/20/50/100/200-day EMAs) but also a clear, watched support floor at $0.0000040 and weekly RSI still oversold (34.29). This sets up a tradable bounce from a defined level, with upside to $0.0000056 if $0.0000045 breaks.
Key Risk: $0.0000040 breaks—then BONK likely flushes to ~$0.000003886 and the “support floor” thesis is dead.
Sell/short BTC exposure if BTC loses its footing after the CPI-driven relief. The article is explicit: BONK’s bounce was almost entirely driven by Bitcoin, not coin-specific news. If BTC rolls over (especially after the macro pop), high-beta meme coins like BONK, DOGE, SHIB, and PEPE typically follow lower fast.
Key Risk: BTC keeps trending higher after CPI relief and holds key support—then meme coins catch up and the downside call fails.
- BONK trades below all key EMAs, signaling strong bearish pressure.
- Recent gains followed Bitcoin's rally, not BONK-specific demand.
- A break below $0.0000040 could trigger deeper losses.
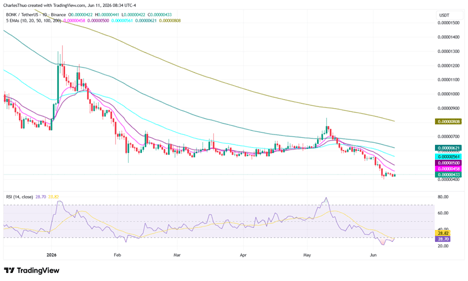
BONK coin is trading at $0.00000430, down roughly 70% from its all-time high and sitting just above a price level that has quietly become one of the most watched support floors.
Notably, the broader meme coin sector has taken a beating, with Dogecoin, Shiba Inu, and Pepe all selling off alongside BONK as the crypto market pulled back last week.
At its current price, BONK coin sits just above the $0.0000040 swing low, a level that has now emerged as the line between a painful correction and a potentially deeper breakdown.
Whether this support holds or breaks will likely define BONK's next major move.
The technicals are heavily stacked against BONK coin
Across 23 tracked technical indicators, the majority are pointing lower.
The moving average breakdown is particularly stark, with the BONK memecoin currently trading below five key daily exponential moving averages (EMAs): the 10, 20, 50, 100, and 200-day EMAs.
Every single one of those averages is sitting above the current price, acting as a layer of overhead resistance that any recovery would need to push through.
That said, the RSI picture is a bit more nuanced.
On the daily chart, the 14-day RSI has recovered slightly to 28.70 from a recent reading of 24.47, which was deep in oversold territory.
On the weekly chart, however, the RSI based on closed candles is sitting at 34.29, a level that historically indicates oversold conditions on longer timeframes.
The daily RSI bounce suggests some near-term pressure has been relieved, but the weekly reading shows that the broader trend still has work to do before momentum shifts.
The 7-day price decline of 13.7% is consistent with what the indicators are showing.
BONK has been in a steady bleed, with losses of 13.7% over the past 7 days, 20.3% over 14 days, and 40.4% over the past 30 days.
On a one-year basis, BONK is down 75.3% from where it was trading 12 months ago.
A macro-driven bounce, rather than a reversal signal
While BONK coin has seen a 2.32% gain in the past 24 hours, the move came with an important caveat: it was almost entirely driven by Bitcoin.
Bitcoin rose 2.72% during the same period, and the total crypto market cap expanded by 2.06%.
The trigger was the May CPI report, which showed US annual inflation at 4.2%, matching forecasts and taking some pressure off the immediate Federal Reserve rate-hike narrative.
That macro relief lifted sentiment across the board and pulled crypto markets out of an "Extreme Fear" reading of 16 on the Fear and Greed Index.
BONK, as a high-beta asset, simply tracked the move, and there was no coin-specific development that drove the price higher.
That matters because it means the bounce is conditional. If Bitcoin loses its footing at $62,000, BONK is likely to follow it lower.
What to expect with the BONK coin price in the coming days
The immediate setup is straightforward.
There are two price levels that matter most right now.
The first is resistance at $0.0000045.
A daily close above that level would place the 7-day simple moving average at $0.00000438 in the rear-view mirror and open the door to the next resistance at $0.0000056, which aligns with the 30-day SMA.
The second, and more critical, level is support at $0.0000040.
What makes the $0.0000040 level particularly significant is not just where it sits on a chart today. It is where BONK bottomed after its first all-time high in November 2023.
A break below that floor would leave BONK coin in open water, with the next major support level at $0.000003886.

Pi Network price forecast: Will Protocol v25 boost overcome token unlock pressure?

DEXE price crashes 80% in 24 hours as alleged team sell-off sparks panic

Movement (MOVE) files for Chapter 11 as $141.4M in funding fails to prevent collapse

XRP stalls below key EMAs: is this recovery weaker than it looks?

Cardano hits a wall near $0.178 as leveraged demand starts to fade
No results found
Loading articles...
Failed to load articles. Please try again.