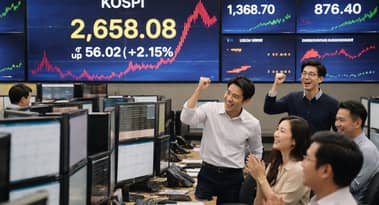
Here’s why the Kospi Index is surging today, and the next target to watch
AI Sentiment: 86/100 Bullish
This score is generated through AI-driven analysis of the article's content.
powered by
Buy iShares MSCI South Korea ETF (EWY) or a KOSPI 200-linked ETF. The Iran deal is a direct oil-shock reversal for Korea (lower crude/gas), which should ease inflation and keep rate hikes off the table. Add the technical setup: Kospi is above rising trendline and 50/100-day EMAs with RSI > 50, so momentum favors continuation toward 8,925.
Key Risk: The Fed turns hawkish (higher-for-longer guidance), forcing global yields up and crushing risk-on even if oil stays lower.
Buy Samsung Electronics (005930.KS) and SK Hynix (000660.KS). The news flow is risk-on plus a tech IPO tailwind (SpaceX signaling a broader IPO wave), which typically lifts high-beta tech/semis first. Korea’s rally is already led by these names, and lower energy costs improve near-term sentiment for exporters.
Key Risk: A sudden risk-off shock (geopolitics or a tech valuation unwind) hits semis harder than the broader market, reversing the leadership.
- South Korea’s Kospi Index jumped by over 5.6% on Monday.
- The index is cheering the deal between the US and Iran.
- Technology companies like Samsung and SK Hynix are leading the charge.
The Kospi Index jumped sharply on Monday as Asian stocks welcomed the new deal between the United States and Iran. It rose to 8,570 KRW, its highest point since June 4, and much higher than this month’s low of 7,373 KRW.
South Korean stocks and bonds are jumping today
The Kospi Index rose by over 5%, mirroring the performance of other Asian stock indices like Japan’s Nikkei 225 and Topix. South Korea’s bonds also jumped, with the ten-year falling to 4.117%, down from the year-to-date high of 4.4%.
This surge happened as investors embraced a risk-on sentiment in the market following the decision by the Trump administration to strike a deal with Iran.
The deal, which has been telegraphed in the past few days, will see Iran reopen the Strait of Hormuz without charging any tolls. This explains why crude oil and natural gas prices plunged on Monday, continuing a sell-off that has been going on in the past few weeks,
The deal is, in particular, highly bullish for South Korea, a country that depends mostly on oil coming from the Middle East. It comes at a time when it has used most of its strategic petrolem reserves.
This deal also means that South Korea’s inflation will reverse in the coming months, making it easier for the central bank to avoid hiking interest rates.
The Kospi Index is also rallying because of the ongoing tech stocks jump after last Friday’s SpaceX IPO, in which the company raised over $75 billion at a valuation of over $1.7 trillion. Its stock then jumped by 19%, with its valuation crossing the $2 trillion mark.
The IPO means that other high-flying technology companies like OpenAI and Anthropic will also file to go public later this year. Such a move will benefit several South Korean companies.
Indeed, the ongoing Kospi Index rally is being led by companies like Samsung, SK Hynix, and SK Square, which jumped by 5.3%, 6.80%, and 7%, respectively. Their market caps jumped to $1.32 trillion, $963 billion, and $116 billion, respectively. SK Square derives most of its value from its ownership of SK Hynix.
Looking forward, the next key catalyst for the Kospi Composite and other indices will be the upcoming Federal Reserve interest rate decision on Wednesday. Analysts expect the bank to leave interest rates unchanged between 3.5% and 3.75% and provide hints on what to expect.
Kospi Index technical analysis
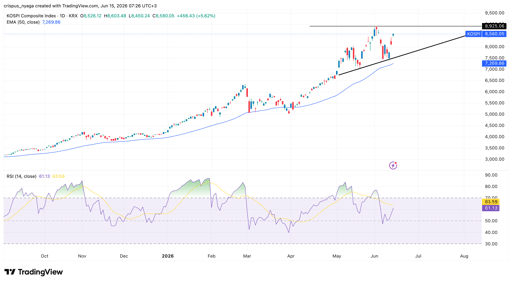
Kospi Composite Index | Source: TradingView
The daily chart reveals that the Kospi Composite Index has done well in the past few months. Its rally has made it one of the best-performing indices globally.
The index has remained above the ascending trendline that connects the lowest swings since May 20th. It has also jumped above the 50-day and 100-day Exponential Moving Averages (EMA).
At the same time, the Relative Strength Index (RSI) has jumped above the neutral point of 50 and is pointing upwards. Therefore, the path of the least resistance for the index is upwards, with the initial target being at 8,925, its all-time high. A move above that level will point to further gains ahead.

Here’s why flying car stocks like Joby and Archer Aviation falling

Alphabet, Tesla earnings set a nervous tone: all eyes on Meta, Amazon and Microsoft
Adani and other Indian power stocks rally on AI play, but are valuations too high?

Why are Nvidia-backed CoreWeave, Nebius, and IREN stocks plunging?

Three 'popular stocks' Cathie Wood has sold in July
No results found
Loading articles...
Failed to load articles. Please try again.