ENA price jumps 26% as Ethena’s $250 million STAC plan fuels breakout buzz

AI Sentiment: 78/100 Bullish
This score is generated through AI-driven analysis of the article's content.
powered by
Buy ENA. It’s up ~26% and is now pressing the $0.095–$0.10 resistance (falling-wedge ceiling). The catalyst is Ethena’s proposed $250M STAC allocation into a Solana-listed tokenized AAA CLO fund, plus rising staked USDe (39%→60%) and stronger volume/momentum. If ENA clears and holds above $0.10, the wedge breakout setup points to a major trend change.
Key Risk: ENA fails to break $0.095–$0.10 and quickly falls back into the wedge, showing the rally was just short-term hype.
Buy Solana (SOL). The news is specifically about STAC expanding onto Solana and Ethena evaluating a large allocation—this is direct demand for Solana’s tokenization/DeFi rails. If ENA’s momentum is real, SOL should benefit from follow-on flows into Solana-based structured-credit and stablecoin infrastructure.
Key Risk: The STAC allocation/gov vote gets delayed, rejected, or doesn’t translate into real on-chain inflows to Solana, leaving SOL to fade with the broader market.
- ENA has gained more than 26% over the past week.
- Ethena is evaluating a proposed $250 million STAC allocation.
- Analysts are tracking a multi-month falling wedge pattern.
ENA has climbed more than 26% over the past week and is now testing the upper boundary of a multi-month falling wedge pattern that analysts say could open the door to substantially higher prices if a breakout is confirmed.
According to CoinGecko data, Ethena's native token traded near $0.0775 on June 13 before advancing to around $0.094 by June 18.
The move has pushed ENA close to a key resistance area between $0.095 and $0.10, a zone that also coincides with the descending trendline that has capped price advances for months.
Recent buying interest emerged shortly after Securitize announced on June 12 that its Tokenized AAA Collateralised Loan Obligation Fund, known as STAC, would expand onto the Solana blockchain.
Around the same time, Ethena Labs disclosed plans to evaluate a proposed $250 million (approx. ₹23.5 billion) allocation into the fund, introducing the possibility of backing its synthetic dollar products with institutional-grade credit assets.
Market participants responded positively to the proposal, viewing the potential allocation as a step toward diversifying reserve backing for USDe and USDtb.
By incorporating AAA-rated credit exposure alongside existing crypto-native mechanisms, the proposal introduced a new source of yield while addressing concerns that have historically surrounded synthetic stablecoin models.
Price performance since the announcement has stood out against a relatively muted crypto market backdrop.
While several major digital assets traded within narrow ranges during the period, capital flowed into ENA as traders positioned themselves ahead of a potential governance vote tied to the STAC allocation.
Analysts watch falling wedge resistance
As the fundamental catalyst gained attention, technical analysts began focusing on ENA's long-term chart structure.
Crypto analyst Captain Faibik noted that ENA is approaching the upper resistance line of a falling wedge pattern that has developed across the daily timeframe since mid-2025.
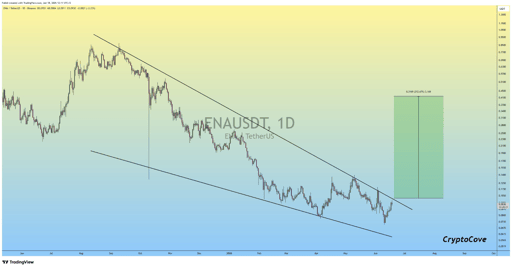
ENA/USDT 1-day price chart. Source: Captain Faibik on X.
The formation contains multiple touches of both the descending resistance and support boundaries, characteristics that technicians often look for when evaluating the validity of a chart pattern.
Faibik's chart outlines a potential move toward $0.3169 if the price breaks above the wedge and sustains momentum.
The target implies a rally of more than 300% from current levels, though it remains conditional on a confirmed breakout above resistance.
Data from the daily ENA/USDT chart adds support to the improving technical picture.
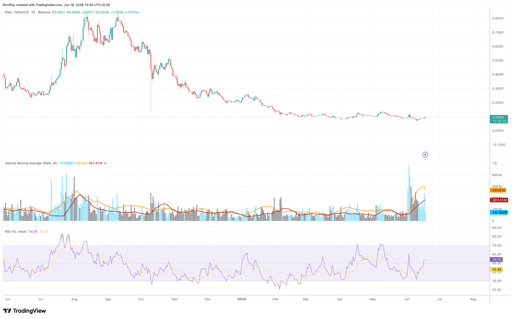
ENA/USDT 1-day price chart. Source: TradingView.
ENA’s trading volume saw a massive spike during the recent rally, with several sessions producing some of the strongest participation seen in months.
Elevated volume accompanying a move into major resistance is often monitored by traders because it can signal genuine demand rather than a short-lived recovery.
Momentum indicators have also strengthened. The Relative Strength Index on the daily chart has recovered to around 53, while remaining below the overbought threshold near 70.
The indicator has also moved above its signal line, suggesting bullish momentum has improved since ENA rebounded from its June lows.
Earlier rallies in August 2025 and April 2026 produced higher RSI readings but struggled to establish a lasting trend reversal.
Current conditions differ in that momentum is rebuilding alongside a notable increase in volume and a fresh fundamental catalyst linked to Ethena's reserve strategy.
Ecosystem growth provides additional support
Behind the recent price advance, Ethena has continued strengthening several areas of its ecosystem during the first half of the year.
Protocol data cited by Ethena showed the share of staked USDe rising from roughly 39% to 60%, indicating that more users have chosen to lock their holdings despite lower yields across parts of the decentralised finance sector.
Integration efforts have also expanded the protocol's presence across major DeFi applications.
Deployments within lending and liquidity platforms such as Aave and Curve have increased the utility of Ethena's products and deepened liquidity around the ecosystem.
For now, will be closely watching the $0.095 to $0.10 resistance zone.
Failure to break through this area would leave ENA trading within its long-term wedge structure, while a decisive move above the descending trendline would strengthen the breakout case outlined by analysts and place higher technical targets into focus.

HYPE reclaims $70, eyes new all-time high as ETF inflows persist

Dogecoin price in danger zone as ETF inflow fails to stop the slide

Is XLM price heading for a breakout as Stellar rally tops 22% this week?

XRP price at crossroads as RLUSD growth battles weak technical signals

Solana rallies over 8%, but charts point to resistance ahead
No results found
Loading articles...
Failed to load articles. Please try again.