Will Bitcoin crash below $60,000 after Fed rate hike shock hits crypto?

AI Sentiment: 18/100 Bearish
This score is generated through AI-driven analysis of the article's content.
powered by
Sell Bitcoin (BTC/USD) with a focus on a breakdown below $64,000. The Fed’s “more tightening” guidance is still the dominant driver, spot BTC ETFs are seeing net outflows, and RSI (~37) plus contracting MACD momentum say rallies are weak. There’s also a clear liquidation map: BTC is sitting on a support/liquidation zone around $63,800–$64,000; a clean break should trigger forced selling and open $63,000 then $61,500–$62,000, with $60,000 next.
Key Risk: The Fed narrative flips to rate cuts sooner (or yields drop fast), and BTC reclaims $65,000–$66,000, squeezing shorts and invalidating the breakdown path.
Sell Coinbase (COIN) versus the crypto complex. The article flags COIN trading at a discount to USDT-based international exchanges for ~5 weeks—classic “institutional demand still weak” behavior. If BTC breaks $64,000, trading volumes and retail/institutional inflows typically deteriorate first for exchanges with weaker relative demand, making COIN a high-beta way to express the bearish crypto tape.
Key Risk: BTC stabilizes above $64,000 and COIN’s discount to USDT venues closes quickly (demand returns), reversing the relative weakness thesis.
- BTC fell after the Fed signaled additional rate hikes in 2026.
- Price action has formed lower highs since the May high.
- Technical indicators show sellers remain in control.
Bitcoin has fallen below $64,000 after the Federal Reserve signaled additional rate hikes in 2026, wiping out a relief rally that had briefly pushed the cryptocurrency above $66,000.
According to market data, Bitcoin climbed to an intraday high of $66,315 on June 17 before reversing course and sliding to around $63,800 during early June 18 trading.
The move came hours after the Federal Reserve left interest rates unchanged at 3.50%–3.75% but projected further tightening this year, a stance that prompted investors to pull back from risk assets.
Earlier in the day, traders had responded positively to reports that the United States and Iran have signed preliminary agreement that could help restore stability around the Strait of Hormuz and ease concerns over global energy supplies.
Oil prices retreated sharply on the news, helping lift equities and cryptocurrencies, while Bitcoin's push above $66,000 triggered more than $150 million (approx. ₹14.1 billion) in short liquidations.
Market sentiment deteriorated after the Fed announcement. Treasury yields remained elevated near 4.16%, while investors became less confident that policymakers would begin cutting rates soon.
At the same time, institutional demand indicators remained weak.
US-listed spot Bitcoin ETFs have recorded $2.1 billion (approx. ₹197.4 billion) in net outflows so far in June, while Coinbase has traded at a discount to international USDT-based exchanges for roughly five weeks, a sign that buying interest from large investors has remained subdued.
Several market participants have pointed to $64,000 as a key support zone.
Following the latest breakdown, analyst WealthManager said a sustained move below that level could reopen the path toward $60,000.
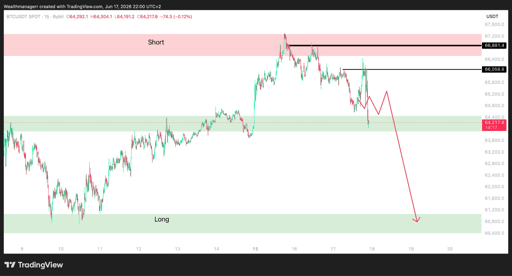
BTC/USD price chart. Source: WealthManager on X.
Bitcoin price analysis
Price action over the past 24 hours shows Bitcoin struggling to regain momentum after the Fed-driven selloff.
After the latest rejection near $66,300, buyers attempted several recoveries, but each rebound produced lower intraday highs before the asset drifted back toward session lows near $63,800.
Technical indicators on the daily chart remain on the bearish side.
The relative strength index has fallen to around 37, remaining below the neutral 50 level and suggesting sellers still hold the advantage.
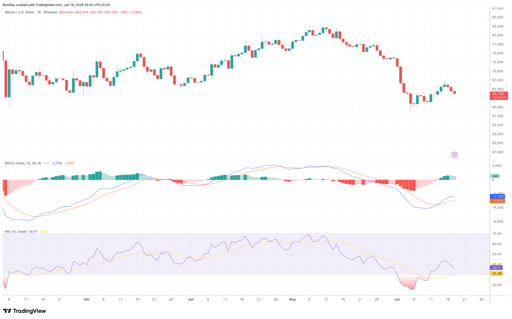
BTC/USD 1-day price chart. Source: TradingView.
Although the MACD has improved from the deeply negative readings recorded earlier this month, its positive histogram bars have started to contract, indicating that the recent recovery has lost strength.
On the 24-hour liquidation heatmap, a large cluster of leveraged positions remains concentrated above the market, particularly between $65,000 and $67,000.
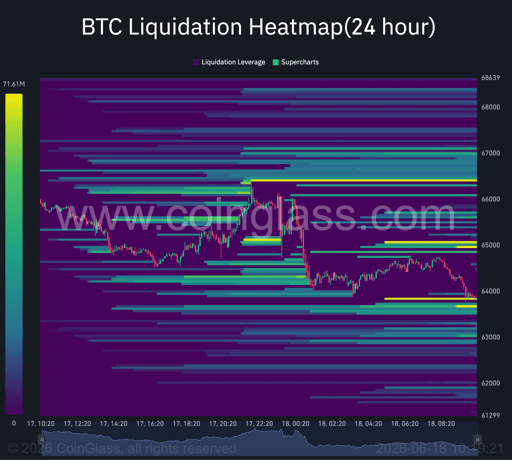
Bitcoin 24-hour liquidation heatmap. Source: Coinglass.
These levels contain significant liquidation pools that could attract price if buying pressure returns.
Near current levels, Bitcoin is sitting directly on top of a liquidity zone around $63,800 to $64,000.
Beneath this area, liquidation concentrations become more visible near $63,000 and again between $61,500 and $62,000.
Should sellers force a clean break below support, those levels could become the next downside targets.
As of press time, the technical structure remains under pressure.
Lower highs have continued to form since Bitcoin peaked near $82,000 in May, while the latest rally attempt failed before reclaiming major resistance.
A move back above $65,000 and eventually $66,000 would place the large overhead liquidity clusters back into focus, but continued weakness below $64,000 could increase the risk of another leg lower toward the low-$60,000 range.

CSPR price climbs 5%: can Casper extend its recovery?

Europe's 2026 digital identity deadline opens a $47 billion market

Will SHIB price crash as whales sell?

Why is Bitcoin crashing today after briefly reclaiming $65,000?

Can Shiba Inu coin price extend its rally as 1T tokens leave exchanges?
No results found
Loading articles...
Failed to load articles. Please try again.