BNB dips below $600 as weak ETF demand and bearish derivatives pressure mount

AI Sentiment: 18/100 Bearish
This score is generated through AI-driven analysis of the article's content.
powered by
Buy BNB downside protection via a put spread (e.g., buy a near-term $570 put and sell a lower strike) to monetize a likely daily close below $570. This directly plays the “support breaks → acceleration” setup while limiting premium burn if BNB chops.
Key Risk: BNB holds $570 and then breaks above ~$625, causing put spreads to lose value quickly as downside momentum fades.
Sell BNB (spot or via inverse/short exposure) targeting a break of $570 support toward ~$488. The article shows weak spot ETF demand, falling futures open interest (less conviction), and a long-to-short ratio below 1 (more shorts than longs). With RSI mid-30s and MACD negative, rallies are likely to fail under the 50-day EMA (~$625).
Key Risk: BNB reclaims and holds above the 50-day EMA (~$625) with improving ETF inflows and rising futures open interest, signaling the sell pressure is over.
- BNB is trading below $600, losing nearly 4% of its value this week.
- BNB's Futures Open Interest (OI) fell to approximately $865.53 million on Friday.
- The coin could drop towards the $500 psychological level if the $570 support fails.
BNB (formerly Binance Coin) continued its downward trend on Friday, trading below $575 and posting losses of nearly 4% over the week.
The token remains under pressure as weak institutional participation, rising short positioning, and declining futures activity reinforce a bearish short-term outlook.
Technically, BNB is now approaching a key support zone near $570, with a breakdown potentially opening the door to deeper losses.
Weak institutional demand offers little price support
Recent data from SoSoValue shows that BNB spot ETF products have recorded minimal activity since their launch on May 28.
The absence of meaningful inflows suggests that institutional investors are not yet providing sustained demand for the asset.
This lack of participation reduces potential downside protection and leaves BNB more exposed to broader market selling pressure.
BNB’s derivatives market continues to weaken, reinforcing expectations of further downside.
Futures Open Interest (OI) fell to approximately $865.53 million on Friday. Although there was a brief recovery in early June, OI has been steadily declining since mid-January.
This sustained drop indicates reduced trader engagement and weakening conviction in the market.
Sentiment data further confirms this trend. CoinGlass reports a long-to-short ratio of 0.88, its lowest level in over a month.
A reading below 1 indicates that short positions outweigh longs, reflecting a clear bearish bias among traders.
The bearish derivatives data and the minimal institutional participation could allow the bears to push BNB’s price towards lower support levels in the near term.
BNB price forecast: $570 support level in focus
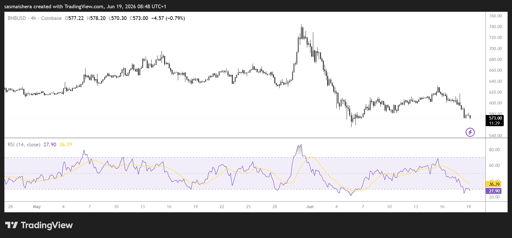
The BNB/USD 4-hour chart remains bearish as BNB is currently trading at $573, extending its bearish momentum after rejection from the 50-day Exponential Moving Average (EMA) at $625.24 earlier in the week.
The coin is looking to test the psychological support level at $570. A decisive daily close below this level could accelerate losses, with a projected downside target around $488.
Momentum indicators continue to favor sellers. The Relative Strength Index (RSI) remains in the mid-30s, signaling weak momentum but not yet a confirmed reversal.
Meanwhile, the Moving Average Convergence Divergence (MACD) remains in negative territory, suggesting that bearish control is still dominant.
If buyers attempt a rebound, immediate resistance is expected at the 50-day EMA near $625.24.
Above that, further barriers appear at the 100-day EMA at $645.88 and the 23.6% Fibonacci retracement at $662.04.
Stronger recovery momentum would be required to challenge the upper boundary of the resistance region near $687.30 and the 200-day EMA at $691.91.
A decisive candle close above these levels could pave the way for BNB to extend its rally in the medium term, with additional resistance levels sitting at $718.89, $764.84, $810.78, $876.20, and $959.52.
BNB’s price action could remain bearish in the near term, with other major cryptocurrencies like Bitcoin and Ethereum also underperforming.

PENGU price struggles after comic debut: why are traders selling?

Is XRP price at risk as Senate delays CLARITY Act vote?

CSPR price climbs 5%: can Casper extend its recovery?

Europe's 2026 digital identity deadline opens a $47 billion market

Will SHIB price crash as whales sell?
No results found
Loading articles...
Failed to load articles. Please try again.