Bitcoin price prediction as weekly spot ETF outflows soar to a record

AI Sentiment: 35/100 Bearish
This score is generated through AI-driven analysis of the article's content.
powered by
The article ties the outflows to money rotating into equities (VOO >$1T AUM; AI/stock-market strength in multiple countries). With risk appetite shifting away from crypto, buy the relative winner: VOO, targeting continued inflows while BTC demand stays pressured.
Key Risk: A sharp risk-off move (rates spike or recession shock) hits equities and forces investors back into crypto as a hedge.
BTC is breaking down below $60,000 while spot Bitcoin ETF outflows hit a record ~$1.79B last week. That’s real demand weakness, not just noise. Sell/avoid exposure in BTC spot and spot-ETF vehicles (IBIT, FBTC, GBTC) until BTC reclaims $67,280 (double-bottom neckline).
Key Risk: ETF outflows stop and BTC quickly reclaims $67,280, turning the $59,000–$60,000 base into a confirmed reversal.
- Bitcoin price dropped below the key support level of $60,000.
- Spot Bitcoin ETFs lost substantial assets last week.
- There are some potential catalysts that may lead to a rebound.
Bitcoin price retreated below the important support of $60,000 as concerns about demand from American investors continued. BTC was trading at $59,930, lower from last month’s high of $82,803. So, will the retreat continue as ETF outflows jump?
Bitcoin ETF outflows are surging
There are signs that American investors are aggressively selling their Bitcoin positions. Data compiled by SoSoValue shows that spot Bitcoin ETFs shed over $1.79 billion last week, the worst performance ever recorded. That is a sign that investors are getting jittery about the coin, with many of them starting to capitulate following its underperformance in the past few years.
The outflows have been spread across all spot Bitcoin ETFs, with the iShares Bitcoin Trust (IBIT) being the most affected. It lost over $444 million in assets on Friday, with the net assets coming in at $44 billion. Fidelity’s FBTC has lost assets to the current $10.4 billion, while Grayscale’s GBTC and BTC have $8.23 billion and $3.2 billion, respectively.
The ongoing spot Bitcoin ETF outflows is happening because American investors are moving to the booming stock market. For example, the Vanguard S&P 500 Index (VOO) has crossed the $1 trillion assets level, while the recently launched DRAM ETF has accumulated over $24 billion in assets.
The same trend is happening in other countries like South Korea, Taiwan, and Japan, where the AI boom is pushing investors to the stock market. In South Korea, the Kospi Index has jumped to a record high and has doubled. Similarly, the Nikkei 225 Index has jumped to a record high.
Some potential catalysts are emerging
There are early signs that Bitcoin price will bounce back in the near term. For example, data shows that consumer inflation is softening as crude oil prices retreat.
Brent and the West Texas Intermediate (WTI) dropped to $72 and $69, respectively. Other commodities like aluminium and copper have also moved downwards in the past few weeks following the US-Iran ceasefire deal.
The falling prices mean that inflation will fall, reducing the urgency for the Federal Reserve to cut interest rates. Economists expect the bank to either leave rates unchanged for the rest of the year or to decide to cut rates in the fourth quarter.
The other potential catalyst is the fact that the Crypto Fear and Greed Index has dropped to the extreme fear zone of 17. In most cases, Bitcoin and other cryptocurrencies tend to do well whenever the index moves to the extreme fear zone.
Bitcoin price has double-bottomed
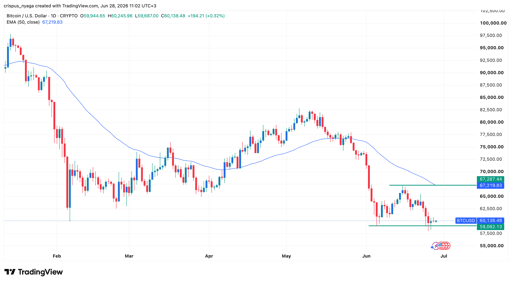
BTC price chart | Source: TradingView
Technicals also suggest that Bitcoin price may have formed a double-bottom pattern at $59,000 and a neckline at $67,280. A double-bottom is one of the most common bullish reversal patterns in technical analysis. This pattern suggests that the coin may be on the cusp of a bullish breakout.
However, the main risk is that it has formed an inverted cup-and-handle pattern, which normally leads to more downside. A move below the key support of $58,000 will point to more downside.

SUI price prediction: Bullish accumulation signals build

SCHD just hit a crucial milestone: is it a good dividend ETF to buy?

From dilution to cash flow: Is BitMine stock worth buying now?

Celestica stock tumbles ahead of earnings: rebound or more pain?

BlackBerry stock has plunged 35% from the YTD high: buy the dip?
No results found
Loading articles...
Failed to load articles. Please try again.