
NEAR bulls defend $1.97, but fading leverage puts the rebound at risk

AI Sentiment: 35/100 Bearish
This score is generated through AI-driven analysis of the article's content.

powered by

Buy NEAR if it holds $1.97 (50-day EMA) and reclaims $2.00. The chart is still above the 200-day EMA ($1.78) and MACD remains positive; the key is that support is being defended while leverage cools. Upside path: $2.56, then $2.85 if $2.00 breaks.
Key Risk: A daily close below $1.97 that turns support into resistance, triggering a slide toward $1.78 and $1.70.
Sell/short NEAR on a clean rejection at $2.00 (descending trendline resistance) with failure to regain $2.00 after a retest. Derivatives are already cooling (falling futures OI and softer funding), so rallies are more likely to fade than break out. Downside path: $1.97 first, then $1.78.
Key Risk: NEAR breaks and holds above $2.00, reviving leverage and pushing toward $2.56/$2.85.
- NEAR is consolidating after failing to break above $2.00 resistance.
- Futures OI and funding rates have declined, signaling easing retail enthusiasm.
- 50-day EMA at $1.97 remains a key support level for maintaining recent recovery.
NEAR Protocol (NEAR) is up by 4% since Sunday, but has failed to overcome a key descending trendline resistance above $2.00.
The rejection has interrupted last week's recovery and shifted traders' attention toward important support around the 50-day Exponential Moving Average (EMA).
While the broader technical structure has improved compared to recent weeks, weakening derivatives activity suggests bullish momentum is beginning to fade.
Retail participation cools after last week's rally
Recent derivatives data indicate that speculative interest in NEAR is easing.
According to CoinGlass, futures Open Interest (OI) has slipped to approximately $448.6 million (approx. ₹42.2 billion) over the past 24 hours as leveraged traders reduce exposure following the latest rejection near resistance.
Lower open interest generally reflects traders closing positions rather than opening new ones, indicating a more cautious market environment.
Funding rates have also softened. The funding rate declined to 0.0031% on Monday from 0.0120% on Friday, suggesting demand for leveraged long positions has weakened.
Although the funding rate remains positive, the decline points to reduced bullish conviction among short-term traders.
NEAR technical outlook: Bulls defend the 50-Day EMA
The NEAR/USD 4-hour chart remains bullish as it trades above its 200-day EMA at $1.78, preserving the broader recovery structure.
However, the latest pullback has brought the cryptocurrency back toward its 50-day EMA near $1.97, which is now serving as the first major support level.
Holding above this moving average would help maintain the current bullish setup.
Conversely, a decisive move below $1.97 could trigger additional selling pressure and expose the 200-day EMA at $1.78.
Below that, the next important support is the descending trendline near $1.70, where buyers may attempt to re-enter the market.
Despite Monday's weakness, momentum indicators continue to show early signs of stabilization.
The Relative Strength Index (RSI) is hovering near 55, reflecting neutral momentum after the recent rebound.
Meanwhile, the Moving Average Convergence Divergence (MACD) remains above its signal line, with expanding positive histogram bars indicating that bullish momentum has not completely faded.
While these signals favor a gradual recovery, buyers will need stronger participation to overcome the current resistance.
The trendline around $2.00 remains the most significant resistance for NEAR.
A successful breakout above that level would strengthen the bullish outlook and open the door for a move toward the previous swing high near $2.56.
If buying momentum continues, the next upside target would be the June 4 high around $2.85.
However, if the sellers regain control, they would encounter the first support at the 50-day EMA near $1.97, followed by the 200-day EMA at $1.78.
A daily candle close below these levels could expose the trendline support around $1.70.
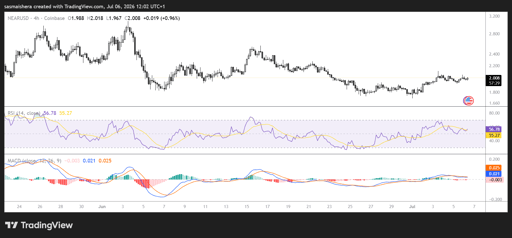
Declining futures open interest and softer funding rates suggest retail enthusiasm is cooling, increasing the importance of the $1.97 support level.
A sustained move above $2.00 would revive bullish momentum and shift focus toward $2.56, while a break below the 50-day EMA could accelerate a deeper correction toward $1.78.

Strategy (MSTR) stock rises 3% as company raises $333M through share sale

Ethereum bulls are paying up, so why is the market refusing to break higher?

PEPE holds key support, but weak momentum could trigger another 10% slide

Solana ETF inflows look bullish after seven weeks: so why is SOL still stuck?

Solana ETF inflows look bullish after seven weeks, so why is SOL still stuck?
No results found
Loading articles...
Failed to load articles. Please try again.