
NZD/USD forecast: bearish signals emerge ahead of RBNZ decision

AI Sentiment: 28/100 Bearish
This score is generated through AI-driven analysis of the article's content.

powered by

Sell NZD/USD. The RBNZ hike is already priced, but falling NZ bond yields and a bearish flag/weak ADX (trend losing steam) point to downside toward 0.5621 then 0.5600. If the RBNZ sounds like “this may be the last hike” due to easing energy prices, the kiwi sells off fast.
Key Risk: RBNZ turns clearly hawkish (signals more hikes) and NZ yields reprice higher, breaking above the 50-day moving average.
Sell NZ government 2-year exposure (e.g., NZD 2Y futures or a 2-year NZD swap/UST-style proxy). The article flags falling 2-year yields (3.348%) despite inflation above target—suggesting the market is underpricing the “not hiking again” risk. A dovish-forward guidance surprise should pressure the front end hardest.
Key Risk: Inflation re-accelerates or RBNZ guidance stays tight, forcing a sharp rise in NZ 2-year yields.
- The NZD/USD pair pulled back after the soft US PMI numbers.
- The RBNZ is widely expected to hike interest rates on Wednesday.
- The pair has formed a bearish flag pattern, pointing to more downside.
The NZD/USD exchange rate pulled back a bit on Tuesday, reacting to more weak US macro data, and as traders refocused on the upcoming Reserve Bank of New Zealand (RBNZ) interest rate decision. It retreated to 0.5693 from last week’s high of 0.5725.
RBNZ expected to hike interest rates
The New Zealand dollar, commonly known as kiwi, retreated as traders waited for the upcoming RBNZ interest rate decision. Market participants expect that the Anna Breman-led bank will decide to hike interest rates by 0.25%.
The bank will do that to combat elevated inflation. Recent data showed that the headline CPI rose 3.1% in the first quarter, remaining above its target of 2.0%, as energy prices jumped.
Ideally, the rate hike should be bullish for the kiwi as it will make it more attractive to investors. However, it could also be bearish, especially if the bank signals that it will not hike again since crude oil and natural gas prices are falling during the US-Iran ceasefire.
This view likely explains why New Zealand’s bond yields are falling. The ten-year yield dropped to 4.45% from last week’s high of 4.485%. Similarly, the rate-sensitive two-year fell to 3.348%.
The RBNZ decision comes at a time when New Zealand’s economy is doing well. A recent report showed that the economy expanded by 1.5% YoY in the first quarter. It was the third consecutive quarter of gains, with the service industry being the main driving force. Goods-producing industries contracted, with the construction sector contracting by 3.8%.
FOMC minutes ahead
The NZD/USD pair will react to the upcoming FOMC minutes, which will provide more information on Kevin Warsh’s first meeting. In it, officials left interest rates unchanged between 3.50% and 3.75%, with the dot plot showing that hawks were in ascendance. 9 members hinted that they would support tightening later this year.
Still, it is unclear whether the recent developments will change their outlooks. For example, jobs numbers released last week showed that the economy added 57k jobs last month, lower than the expected 114k. The BLS also revised the previous month’s jobs report lower from 172k to 129k.
Recent PMI numbers also came lower than expected. The ISM non-manufacturing PMI and the S&P Global services PMI fell to 54 and 51.2, respectively. Last week’s manufacturing PMI figure also came short of expectations.
NZD/USD technical analysis
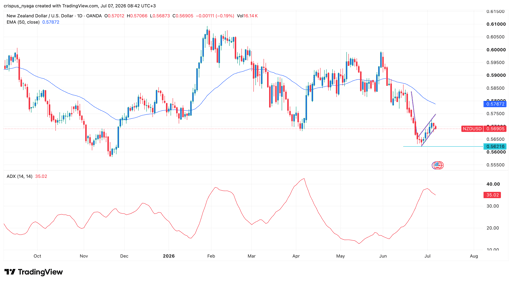
NZD/USD chart | Source: TradingView
Technicals suggest that the recent NZD/USD pair uptrend may be losing steam as the Average Directional Index (ADX) has dropped from 38.4 on July 1 to 35 today. The pair has also remained below the 50-day moving average, and has formed a bearish flag pattern.
These technicals point to more downside in the near term. If this happens, it will drop to the key support level of 0.5621, its lowest level in June this year. A drop below that price will signal that bears have prevailed and push it lower, potentially to 0.5600. A clear bullish breakout will be confirmed if it moves above the 50-day moving average level.

Crypto price predictions: Dogecoin, XRP, Venice Token (VVV)

Zcash price prediction: Here’s why ZEC token has gone parabolic

ARB price prediction: How Robinhood Chain growth is boosting Arbitrum

AMD stock forecast: why this Nvidia rival is on the cusp of a breakout

Blue Owl stock may short squeeze as golden cross emerges amid turnaround
No results found
Loading articles...
Failed to load articles. Please try again.