
Why is LayerZero price up today?

AI Sentiment: 78/100 Bullish
This score is generated through AI-driven analysis of the article's content.

powered by

Buy LayerZero (ZRO) for a continuation move after it reclaimed the 200 EMA (~$0.96) and broke above $1.00 on Robinhood ecosystem/tokenized-RWA interoperability chatter plus Catapult Trade integrating LayerZero’s OFT into its multichain launchpad. Target $1.08 first, then $1.22 if it clears. Key setup is demand holding the $1.00 breakout while higher-timeframe momentum is rebuilding.
Key Risk: Robinhood/Catapult integration timelines slip or fail to materialize, causing the $1 breakout to quickly reverse and ZRO to fall back below the 200 EMA.
Sell/short ZRO for a quick pullback trade because 4-hour RSI is ~73 (overbought) and price is consolidating right after a breakout. Play for mean reversion toward the reclaimed $1.00 area and possibly the 4-hour moving averages if momentum cools. Exit quickly if it reclaims and holds above ~$1.08.
Key Risk: The rally accelerates and ZRO breaks above ~$1.08 with strong volume, turning the overbought signal into a sustained trend.
- ZRO price surpassed $1, backed by multiple positive catalysts.
- ZRO has climbed above its 20, 50, 100 and 200 EMAs.
- The daily chart points to $1.08 as the next major resistance.
LayerZero ZRO has climbed above the psychological $1 level after a combination of Robinhood ecosystem developments and a new infrastructure partnership boosted buying interest and strengthened the token's technical outlook.
According to Robinhood's recently unveiled blockchain roadmap, traders have turned increasingly optimistic after LayerZero emerged as part of Robinhood's expanding layer-2 infrastructure plans.
Robinhood is preparing to move tokenized real-world assets, including stocks and ETFs, onto public blockchain rails, prompting speculation that LayerZero's cross-chain messaging protocol could become a key interoperability layer connecting those assets across networks.
If deployed as expected, the integration would place LayerZero at the centre of a network serving Robinhood's large retail user base while reducing friction for cross-chain transactions.
The prospect of additional retail participation helped lift demand for ZRO as investors positioned ahead of any future network activity.
Buying momentum received another boost after Catapult Trade recently announced it would integrate LayerZero's Omnichain Fungible Token standard into Catapult Hyper, its multichain token launchpad.
By using LayerZero's interoperability infrastructure, the platform is expected to route multichain activity through the protocol, giving the network another source of on-chain utility beyond speculative trading.
Both developments have helped push ZRO through the resistance around $1.00, which was also viewed as a positive development within trading circles.
Will the ZRO rally continue?
Recent price action suggests the recovery has strengthened, although technical indicators point to both continued momentum and the possibility of short-term consolidation.
On the 4-hour chart, ZRO has reclaimed its 20, 50, 100, and 200 exponential moving averages, with the token now trading above all four levels after spending several weeks below the longer-term trend indicators.
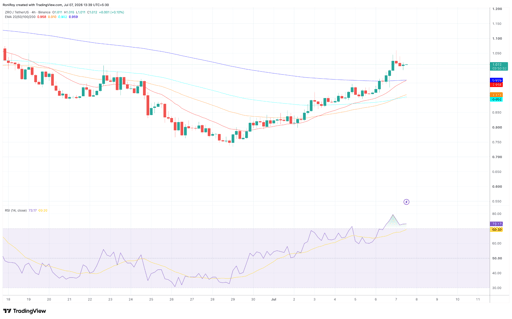
ZRO/USDT 4-hour price chart. Source: TradingView.
The recovery above the 200 EMA near $0.96 is particularly notable because the level had acted as dynamic resistance during the previous decline.
Holding above it would strengthen the case that the recent breakout is becoming more established.
The same chart shows the Relative Strength Index climbing to about 73, placing it in overbought territory.
While elevated RSI often accompanies strong rallies, it can also signal that buyers may pause or lock in profits before attempting another move higher.
The daily chart also points to improving market structure.
After recovering from its recent lows, ZRO has moved above the 0.382 Fibonacci retracement level near $1.00, indicating buyers have regained control of a meaningful portion of the previous downtrend.
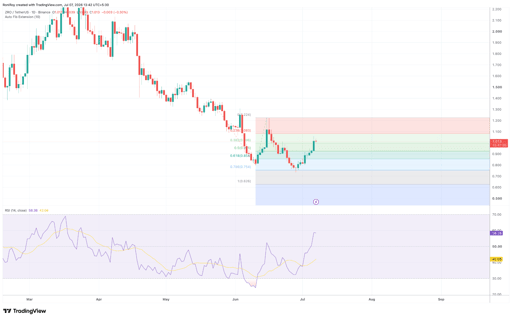
ZRO/USDT 1-day price chart. Source: TradingView.
If bullish momentum continues, the next technical resistance sits near the 0.236 retracement around $1.08, while a successful breakout above that level could bring the previous swing high near $1.22 back into focus.
Momentum on the higher timeframe remains constructive as well.
The daily RSI has recovered to around 58, leaving room for additional upside before entering overbought territory.
At the same time, the 0.50 Fibonacci level near $0.91 and the 0.618 retracement around $0.85 could serve as support if the token experiences a pullback after its recent gains.
CoinGecko data also shows buyers defending the $1.00 area after ZRO briefly rallied above $1.05 before the rally slowed down.
While the token has given up some of its gains, it now seems to be consolidating around the breakout level, suggesting demand has so far absorbed selling pressure following the latest rally.
With both the recent catalysts supporting the fundamental case and technical indicators showing an improving trend, traders will likely watch whether ZRO can maintain support above $1.00 and the reclaimed 200 EMA while attempting to challenge resistance near $1.08 in the sessions ahead.

Why is XRP falling even as ETF money keeps flowing into the market?

Why is Ethereum stuck below $2,500 even as ETF inflows stay strong?

Is Bitcoin’s $80,000 wall about to crack, or are whales ready to sell?

Bitcoin holds near $80K as Fed hike bets rise, ETF inflows continue

Solana targets $120 as ETF inflows and network activity rise
No results found
Loading articles...
Failed to load articles. Please try again.