
Pi Network price slides for fifth day as $0.10 support comes into focus

AI Sentiment: 18/100 Bearish
This score is generated through AI-driven analysis of the article's content.

powered by

Buy BTC as a hedge against PI-specific downside only if broader crypto stabilizes; otherwise stay out. The article flags broader risk-asset uncertainty (US–Iran tensions) and weakening retail/derivatives in PI. If risk-off hits alts harder than BTC, PI underperforms while BTC holds up better—use BTC spot or BTC futures as the relative-strength anchor.
Key Risk: BTC also breaks down with the broader market, removing the relative-strength cushion and dragging PI and BTC together.
Sell PI (or short via PI perpetuals) into the $0.1010 support test. The setup is bearish: 5 straight daily losses, RSI ~31 (oversold but not reversal), MACD still below zero, and derivatives confirm fading demand (open interest down; funding deeply negative at -2.15%). If $0.1010 breaks, expect a fast move toward $0.0867.
Key Risk: PI holds $0.1010 and quickly reclaims $0.1324 (50-day EMA), proving the selloff was a one-off oversold bounce.
- PI falls for five days, nearing the crucial $0.10 support zone.
- Bearish signals persist despite oversold readings, raising downside risk.
- A break below $0.1010 may expose PI to $0.0867 support.
Pi Network (PI) remained under pressure on Wednesday, sliding toward the $0.1000 mark and recording its fifth consecutive daily loss.
The coin is down by nearly 7% in the last 24 hours as the broader crypto market retraces.
Weakening retail participation, declining derivatives activity, and an increasingly bearish technical setup continue to weigh on the token's short-term outlook.
The latest decline comes as cryptocurrency markets navigate mixed investor sentiment, with renewed geopolitical tensions between the United States and Iran adding uncertainty across risk assets.
Open Interest and funding rates signal weakening demand
Retail sentiment toward Pi Network has deteriorated in recent sessions, according to derivatives data.
Figures from CoinAnk show that PI Open Interest dropped to $9.75 million on Wednesday from the $10.88 million recorded on Tuesday.
The decline suggests traders are closing positions rather than opening new ones, reflecting reduced confidence in the token's near-term direction.
At the same time, PI's funding rate has fallen sharply to -2.1546%, highlighting growing bearish positioning in the perpetual futures market.
Negative funding rates indicate that short sellers are paying long traders to maintain their positions, reinforcing expectations of additional downside.
Together, these metrics point to fading retail interest and increasing caution among market participants.
Pi Network technical forecast: Can the $0.10 support hold?
The PI/USD 4-hour chart is extremely bearish following its recent losses. Pi Network is now approaching a crucial technical support zone around the $0.1010 level, which could determine its next major move.
If buyers fail to defend this level, PI could fall below the psychologically important $0.1000 threshold for the first time in the current bearish correction.
A decisive breakdown could expose PI to the next key support level near $0.0867.
Momentum indicators remain firmly tilted in favor of the bears despite the recent decline pushing PI into oversold territory.
The Relative Strength Index (RSI) is hovering near 31, indicating that selling pressure has become extreme.
While such readings can sometimes precede a short-term rebound, oversold conditions alone are not enough to signal a trend reversal.
Meanwhile, the Moving Average Convergence Divergence (MACD) remains below both its signal line and the zero level, confirming that bearish momentum continues to dominate the market.
Unless buying interest returns, any recovery attempts are likely to face renewed selling pressure.
If the selloff persists, the bears would encounter the immediate support level at the S1 Pivot Point at $0.1010.
Losing this support could accelerate the decline toward $0.0867, marking the next major downside target.
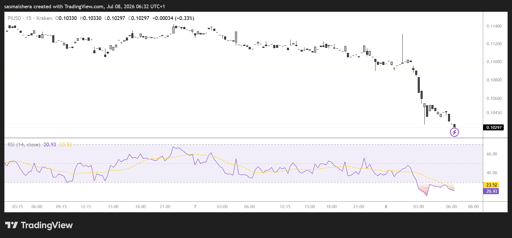
However, if the bulls regain control, the first resistance is located near the 50-day Exponential Moving Average (EMA) at $0.1324, followed by the R1 Pivot Point at $0.1397.
For the short-term outlook to improve, PI will need to reclaim these resistance levels and attract renewed buying interest.
Until then, the broader technical picture continues to favor further downside.

Can BONK survive the $20 million treasury exploit as sellers pile in?

Lido DAO price surge puts $0.42 resistance in focus as bulls return

MemeCore rebound stuns traders as M token claws back from 82% crash

Cardano price crash: ADA bulls face whale pressure as bears tighten grip

Is Ethereum’s 10% rebound strong enough to break the $1,800 barrier?
No results found
Loading articles...
Failed to load articles. Please try again.
