
Goldman Sachs stock forms a risky pattern ahead of earnings
AI Sentiment: 35/100 Bearish
This score is generated through AI-driven analysis of the article's content.

powered by

Sell GS. The chart is flashing a head-and-shoulders reversal (neckline ~1,000) plus a bearish diamond setup, and MACD is rolling over. Even with “strong earnings” expectations, the stock is already down ~6% from the YTD high and looks positioned for a post-earnings breakdown toward the neckline (~$1,000).
Key Risk: Earnings and guidance beat hard enough to push GS above ~$1,125 (the head area), flipping the technical breakdown back to a rally.
Sell GS options via a bearish earnings move: buy a put spread (e.g., buy the $1,000 put, sell the $950 put) into the print. The setup is “good news priced in” with bearish technicals; if the stock gaps up only modestly, the put spread still benefits from a failure to sustain gains.
Key Risk: A strong upside earnings surprise that drives GS well above the $1,000 strike area, making the put spread lose value quickly.
- Goldman Sachs stock has formed a head-and-shoulders pattern.
- It has also formed a diamond reversal pattern on the daily chart.
- The company is expected to publish strong financial results.
Goldman Sachs stock has pulled back more than 6% from its year-to-date high and has gradually formed a risky chart pattern ahead of its second-quarter earnings on Tuesday. The stock was trading at $1,055 and appears vulnerable to further downside despite expectations for strong earnings.
Goldman Sachs stock is at risk of falling after earnings
The GS stock price has pulled back in the past few weeks, moving from a high of $1,125 on June 15 to $1,055. It has formed a head-and-shoulders pattern, a common bearish reversal sign in technical analysis. Its head is at $1,125, while the right and left shoulders are at $1,100. The neckline is at $1,000.
The stock has also formed what looks like a diamond reversal pattern, which normally leads to a bearish breakout over time. At the same time, the two lines of the MACD indicator formed a bearish crossover and are pointing downwards.
Therefore, there is a risk that the stock will retreat in the coming weeks, potentially to the neckline at $1,000. The bearish outlook will become invalid if it jumps above the head section of $1,125.
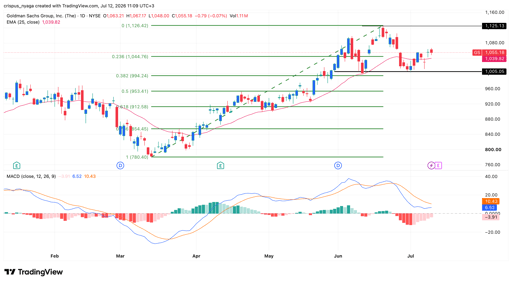
GS stock chart | Source: TradingView
Goldman Sachs expected to publish strong results
On the positive side, all signs are that the company will publish strong financial results on Tuesday this week.
All indications are that its business is having one of its best years. For example, data compiled by the Wall Street Journal shows that Goldman Sachs has advised M&A deals worth over $1.2 trillion this year, much higher than JPMorgan’s $843 billion.
Goldman Sachs has also led as the top bookrunner in IPOs this year, with the value of deals rising to over $67.9 billion, higher than last year’s $35 billion. Dealogic estimates that its investment banking revenue jumped to over $5.7 billion, higher than last year’s $4.1 billion.
The most recent results showed that its business boomed in the first quarter, with the Global Banking and Markets division rising by 11% to over $12.7 billion. Its asset and wealth management revenue rose by 10% to $4 billion.
READ MORE: Goldman Sachs stock has soared: here’s why it has more gains ahead
This growth likely continued growing in the second quarter as its investment banking and trading businesses soaring. Its investment banking revenue is benefiting from major deals, including the recent SpaceX IPO and the recent SK Hynix listing. It also took part in the $67 billion deal between NextEra and Dominion Energy.
Trading has also continued booming this year, helped by the US-Iran war that has led to substantial market volatility.
Analysts anticipate that the upcoming results will show that its business continued to boom. The average estimate is that its revenue rose by 12.50% to $16.4 billion, while its guidance for the third quarter will be $16 billion. Goldman has a long history of doing better than expected.
Analysts have a bullish outlook for the company. Bank of America boosted its target from $1,050 to $11,50, while UBS hiked from $940 to $1,120. BMO Capital Markets and Morgan Stanley hiked to $1,070 and $1,099.

Why SpaceX stock is up around 1% on Friday

Should you buy the dip in OKLO stock today?

Analyst: Adobe stock's post-earnings dip isn't about AI disruption fears only

Dow surges 500 points after four-day slide as oil prices retreat

Here’s why the Enbridge stock is in a strong downward trend
No results found
Loading articles...
Failed to load articles. Please try again.