
Here's why Solana pulled back after briefly climbing towards the $78 mark

AI Sentiment: 28/100 Bearish
This score is generated through AI-driven analysis of the article's content.

powered by

Buy ETH. The article says capital rotated toward Ethereum as it outperformed BTC and other L1s, helped by renewed institutional interest and improved Japan sentiment. With SOL facing ETF outflow headwinds and weaker short-term momentum, relative strength should persist. Target a move back toward recent strength versus BTC/alt basket; stop if ETH loses its near-term uptrend and starts underperforming again.
Key Risk: Institutional flows reverse and rotate back into SOL (or risk-off hits crypto broadly), causing ETH relative strength to fade.
Sell SOL/USDT. The bounce stalled under the 20-day EMA (~$76.8) and 50-day EMA (~$78.8), and it failed to reclaim the 23.6% level near $78.13. Momentum is weak (4H RSI ~44), and ETF spot outflows ($707k) plus profit-taking can keep pressure on thin volume. Target $74.8 then $72.1; stop back above ~$78.2.
Key Risk: SOL reclaims $78.13 and then breaks the $80–$81 resistance zone, flipping momentum and forcing shorts to cover.
- Solana pulled back after briefly climbing above $78.
- ETF outflows continued, with four red days in the past five sessions.
- SOL is holding a key support, $80 remains the next major resistance.
Solana briefly climbed above $78 before giving back part of its recent gains, as traders locked in profits after a liquidity-driven rally while fresh ETF outflows and weaker short-term momentum capped the recovery.
According to CoinGecko data, Solana (SOL) traded around $77 on July 16 after slipping about 1% over the previous 24 hours.
The token had briefly climbed to nearly $78 a day earlier as crypto markets rallied following softer-than-expected US inflation data, but it later retreated as buying momentum slowed.
The rebound gained speed after the USDC Treasury minted 250 million USDC on the Solana network on July 15, injecting fresh liquidity into the ecosystem.
The new supply arrived as cooling US consumer inflation reduced expectations for an aggressive Federal Reserve rate hike, encouraging investors to rotate back into risk assets.
Capital also flowed into Solana-based decentralised exchanges, helping SOL recover from its recent lows.
Buying interest, however, faded as traders began taking profits after the sharp move higher.
Bitcoin also eased from its recent highs, removing some of the support that had lifted large-cap altcoins during the previous session.
Another factor weighing on sentiment came from institutional flows. Spot Solana exchange-traded funds recorded a net outflow of $707,100 on July 15, reversing a string of recent inflows.
Although the latest outflow was relatively small, it extended a five-day trend in which spot Solana ETFs recorded outflows on four days, signaling that institutional buyers had largely stepped back.
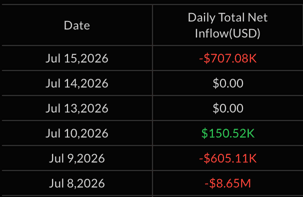
Source: SoSoValue.
With trading activity remaining subdued, even modest ETF redemptions had a larger impact on price action.
The weaker volume also allowed algorithmic and short-term traders to respond more aggressively to the outflow data, adding selling pressure during Thursday's session.
Capital rotation within the crypto market also favored Ethereum, which outperformed both Bitcoin and several major layer-1 tokens after renewed institutional interest and recent regulatory developments in Japan improved sentiment toward the second-largest cryptocurrency.
The move temporarily diverted attention away from Solana despite continued activity on its network.
Solana price analysis
The daily chart shows Solana attempting to recover from its June low near $60, but the rally has stalled beneath several key resistance levels.
SOL is trading below the 20-day EMA at $76.78 and the 50-day EMA at $78.76, while remaining well under the 100-day EMA at $80.89 and the 200-day EMA at $94.63.
See below:
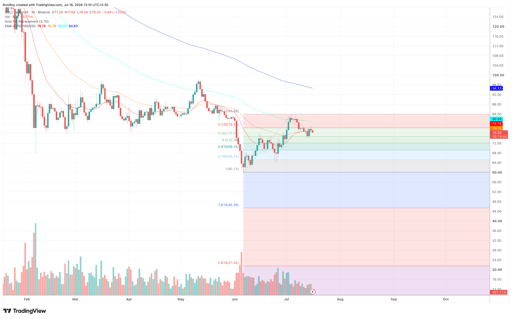
SOL/USDT 1-day price chart. Source: TradingView.
This indicates that the longer-term trend remains under pressure even after the recent bounce.
Fibonacci retracement levels also point to a key battle around current prices.
Solana failed to reclaim the 23.6% retracement level at $78.13 and has slipped back toward the 38.2% retracement at $74.81, which now serves as the first major support.
Below that, additional downside levels appear near $72.06 at the 50% retracement and $69.24 at the 61.8% level if sellers gain control.
On the 4-hour chart, SOL has dropped below the Bollinger Bands' middle line around $76.56 after repeatedly failing to sustain moves toward the upper band near $78.58.
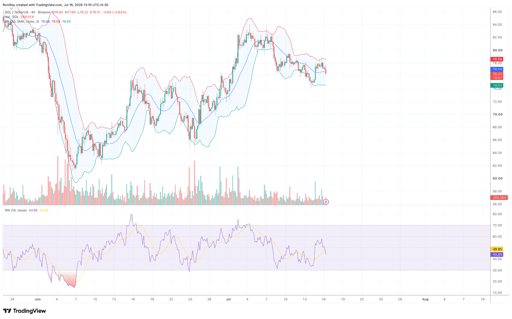
SOL/USDT 4-hour price chart. Source: TradingView.
The lower band around $74.53 represents the next short-term support if selling pressure continues.
Momentum indicators also favor caution.
The 4-hour Relative Strength Index has fallen to around 44, below the neutral 50 level and beneath its signal line, indicating that bullish momentum has weakened without entering oversold territory.
Based on this reading, sellers still have room to push prices lower before exhaustion becomes evident.
As of publication time, it looks like Solana is in a consolidation phase following its CPI-driven rally.
A recovery above the 20-day and 50-day EMAs, followed by a decisive move through $78.13 and the $80-$81 resistance zone, would strengthen the bullish case and could expose the next upside targets above $84.
On the downside, failure to hold the $74.80-$74.50 support region could send SOL toward $72, while a deeper correction may bring the $69 area into focus.
As long as price continues to trade between these levels, Solana is likely to remain range-bound unless a new catalyst emerges.

PURR stock price forecast as Hyperliquid’s HYPE token hits a record high

Bitcoin ETFs keep buying, so why is BTC still stuck below $80K?

Why XRP traders are watching $1.47 as Evernorth and ETF demand build pressure

ENA explodes 10% as Ethena moves to kill its biggest token overhang

Can Ethereum price reclaim $2,500 as ETF demand battles profit-taking?
No results found
Loading articles...
Failed to load articles. Please try again.