
Why are ADA traders betting against Cardano after a landmark hard fork?

AI Sentiment: 28/100 Bearish
This score is generated through AI-driven analysis of the article's content.

powered by

Buy downside protection in ADA using a put spread (e.g., buy a near-term put around $0.150 and sell a lower strike near $0.138). The thesis is that $0.150 support is the line in the sand; a decisive break likely triggers a move to the $0.138 demand zone, especially with more shorts than longs (long-to-short < 1).
Key Risk: ADA holds $0.150 and rallies back above $0.177, making the puts lose value quickly.
Sell Cardano (ADA) via perpetual futures while funding is negative (bearish positioning) and price remains below the 50-day EMA (~$0.177) with weak momentum (RSI < 50). The Van Rossem hard fork is a long-term positive, but the market is not rewarding it yet—so fade the “upgrade hype” until ADA reclaims $0.177 and holds.
Key Risk: ADA breaks and closes above the 50-day EMA (~$0.177) and then pushes toward $0.202, forcing shorts to cover.
- Cardano (ADA) has slipped by 2% in the last 24 hours, dropping to $0.161.
- Cardano’s recent Van Rossem hard fork introduced Protocol Version 11.
- The funding rates and long-to-short ratio paint a bearish picture for ADA.
Cardano ADA is down by more than 2% on Monday and is currently trading at nearly $0.161.
The coin is struggling to extend last week's recovery despite the successful activation of the Van Rossem hard fork, one of the network's most significant protocol upgrades.
The update introduced Protocol Version 11, bringing lower smart contract execution costs and enhanced Plutus functionality.
While the milestone strengthens Cardano's long-term fundamentals, traders remain cautious, limiting any immediate upside in ADA's price.
Van Rossem hard fork marks a governance milestone
Cardano activated the Van Rossem hard fork on Saturday, making it the network's first major protocol upgrade to be fully approved and ratified through its onchain governance system.
van Rossem hard fork update 🍴
— Intersect (@IntersectMBO) July 18, 2026
The van Rossem hard fork has been successfully enacted on Cardano Mainnet! 🎉
We would like to take a moment to recognise the work of the Hard Forking Working Group to get us to this moment. Coordinating ecosystem partners, SPOs, DApps,… pic.twitter.com/SSleGfA5zE
The upgrade delivers several technical improvements, including:
- Reduced smart contract execution costs through updated cost models.
- New capabilities for the Plutus smart contract platform.
- Technical groundwork for Cardano's upcoming Dijkstra era.
- A demonstration of the network's decentralized governance process.
The successful implementation reinforces Cardano's long-term development roadmap by improving scalability and reducing transaction costs for decentralized applications.
Although the upgrade represents a significant achievement for the ecosystem, the market reaction has remained muted, with ADA continuing to trade within a narrow range.
Market positioning suggests investors are still uncertain about Cardano's short-term direction.
According to Coinglass data, ADA's funding rate turned negative on Friday and stood at -0.0029% on Monday.
Negative funding rates indicate that traders holding short positions are paying those with long positions, typically reflecting a bearish sentiment in perpetual futures markets.
Furthermore, Cardano's long-to-short ratio stood at 0.84 on Monday.
A ratio below 1.0 indicates there are more short positions than long positions, suggesting many traders continue to expect additional downside despite the recent protocol upgrade.
Cardano technical outlook: Key levels to watch
Although ADA recovered modestly during the previous week, the broader technical picture remains bearish.
Bears retain control below major moving averages. Currently, Cardano is trading below the 50-day EMA at approximately $0.177, the 100-day EMA ($0.205), and the 200-day EMA ($0.273).
Remaining below these key trend indicators suggests sellers still control the broader market structure.
Meanwhile, the Relative Strength Index (RSI) remains just below the neutral 50 level, indicating weak momentum and a lack of clear directional conviction.
The Moving Average Convergence Divergence (MACD) has edged into positive territory but continues to generate only modest bullish momentum.
If buyers regain momentum, ADA could face resistance at the $0.173 level, with another hurdle at the 50-day EMA of $0.177.
A daily candle close above these levels could pave the way for ADA to extend its rally towards the previous trigger zone at $0.202 and the 100-day EMA at $0.205.
The 200-day EMA at $0.273 remains a medium-term target for the bulls.
A sustained move above the 50-day EMA would improve the short-term outlook, while reclaiming the 100-day EMA could signal a stronger recovery.
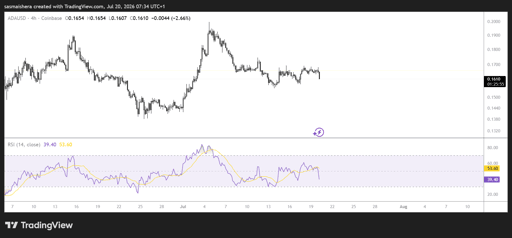
On the downside, traders are watching the immediate support at $0.150. A decisive close beyond this level could see ADA slip towards the major demand zone at $0.138.
A break below $0.150 could expose ADA to renewed selling pressure toward $0.138, reinforcing the prevailing bearish trend.

XRP dips to $1.32 despite 11-day spot ETF inflow streak

How high can PI price go as Protocol 27 upgrade nears?

Bitcoin’s $82,000 test is coming as one major market signal turns bullish

Ethereum slips toward $2,400: key ETH levels to watch if support breaks

Can ARB price reach $0.14 after 30% rally powered by Robinhood chain?
No results found
Loading articles...
Failed to load articles. Please try again.