
How high can BEAT go as whale withdrawals drain exchange supply?

AI Sentiment: 78/100 Bullish
This score is generated through AI-driven analysis of the article's content.

powered by

Buy BEAT spot. The news shows exchange outflows tightening liquid supply (whale withdrawals + token burns) while spot/derivatives activity is rising (OI +90% spot/derivs volume). Price is also above all major EMAs and ADX has flipped back above 25, with Chaikin Money Flow positive—momentum + liquidity squeeze align. Target the next liquidation-driven upside pocket: push through $3.25 to unlock $3.40, then $3.55–$3.60.
Key Risk: Whale withdrawals reverse and exchange balances rebuild fast, flooding the market and breaking the supply-tightening narrative.
Buy BEAT perpetuals (long) with the intent to ride forced-covering. The article flags dense short liquidation clusters just above $3.20–$3.35; a sustained move through $3.25 should trigger additional short liquidations and accelerate price. This is a momentum trade on leverage flows, not just spot demand.
Key Risk: Price chops sideways under $3.25, letting longs get bled by funding/volatility while shorts avoid liquidation.
- BEAT has jumped over 16% as whale buying and token burns tightened supply.
- More than $1.8 million worth of BEAT has been withdrawn from exchanges.
- Technical indicators and derivatives data continue to support ongoing rally.
BEAT has extended its rally by more than 16% over the past 24 hours as whale accumulation, token burns, and rising derivatives activity have fueled renewed buying interest.
According to CoinGecko data, BEAT traded around $3.20 at the time of writing after climbing roughly 16.3% during the past day and more than 23% over the last week.
The rally has coincided with a series of large on-chain withdrawals from centralised exchanges, accelerating token burns and stronger activity across both spot and derivatives markets.
According to Arkham data, a whale address accumulated more than 473,000 BEAT, worth about $1.1 million (approx. ₹103.4 million), through repeated withdrawals from Gate.io.
The buying reportedly became large enough for Gate.io to transfer nearly $1 million (approx. ₹94 million) worth of BEAT from its cold wallet into a hot wallet to replenish exchange liquidity after the withdrawals.
Large holders were active on other exchanges as well.
Arkham data also showed another wallet withdrawing 160,000 BEAT, valued at about $440,000, from MEXC into self-custody, while roughly $274,000 worth of BEAT moved from HTX into a Gnosis Safe multi-signature wallet, a setup commonly used for long-term custody.
Supply on the open market tightened further as approximately 1.58 million BEAT, valued at more than $4 million (approx. ₹375.9 million), was transferred to burn addresses over the past week, permanently removing those tokens from circulation.
Combined with continued exchange withdrawals, the reduced liquid supply has coincided with the token's latest advance.
Network activity has also continued to expand. Audiera said the BEAT ecosystem recently surpassed 20.48 million cumulative on-chain transactions since launch, citing data from its Dune Analytics dashboard.
Earlier this month, the project also reported cumulative decentralised exchange trading volume exceeding $9.1 billion (approx. ₹858.1 billion), pointing to sustained user activity alongside the latest price rally.
Derivatives traders pile into BEAT rally
As spot demand strengthened, speculative participation also accelerated.
Derivatives data showed 24-hour trading volume rising 90.56% to $174.2 million (approx. ₹16.4 billion), while open interest climbed 20.66% to $86.3 million (approx. ₹8.1 billion), which is a sign that fresh capital is entering leveraged positions.
As of publication time, market positioning remains slightly tilted toward bulls.
The overall 24-hour long-to-short ratio stood at 1.0186, while Binance account positioning reached 1.3906. Binance's top traders were even more bullish, with long-to-short ratios of 1.2026 by accounts and 1.4909 by positions.
Liquidation data also showed sellers absorbing most of the recent pressure.
During the past 24 hours, about $242,640 in short positions were liquidated compared with roughly $33,140 in long liquidations, suggesting rising prices forced bearish traders to exit leveraged positions.
BEAT price analysis
The daily chart remains in favor of buyers after recovering from June's sharp correction.
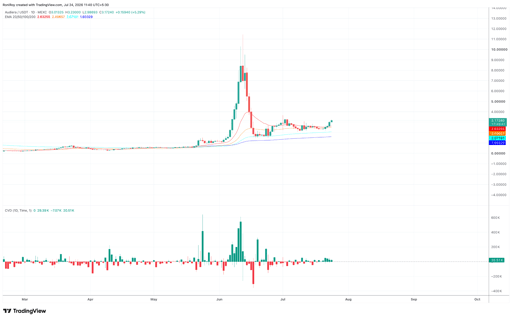
BEAT/USDT 1-day price chart. Source: TradingView.
BEAT remains comfortably above its 20-day, 50-day, 100-day and 200-day exponential moving averages, which currently sit near $2.63, $2.50, $2.07 and $1.60.
The bullish alignment of those moving averages indicates the medium-term uptrend remains intact, while the latest rally has pushed price further above the nearest dynamic support.
Trend strength has also begun improving again. The Average Directional Index has risen to around 31, placing it above the widely watched 25 threshold that traders often associate with a strengthening trend.
See below:
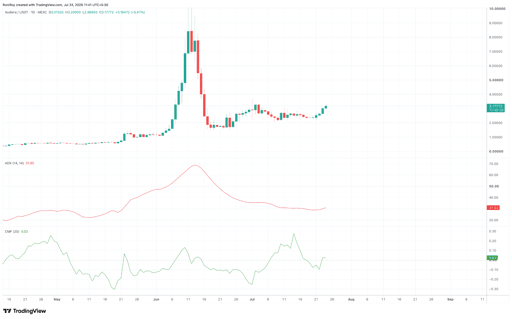
BEAT/USDT 1-day price chart. Source: TradingView.
At the same time, the 20-day Chaikin Money Flow has returned to positive territory near 0.02, indicating capital has started flowing back into the asset after several weeks of mixed buying and selling pressure.
BEAT’s cumulative Volume Delta has also turned positive again, showing buyers have recently been more aggressive than sellers.
This pattern aligns with the increase in spot withdrawals and whale accumulation observed on-chain.
The 24-hour liquidation heatmap from CoinGlass shows another potential catalyst if buying continues.
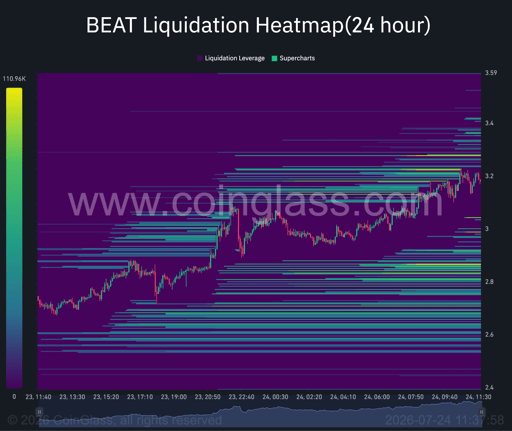
BEAT 24-hour liquidation heatmap. Source: TradingView.
Dense clusters of leveraged short positions remain stacked just above the current market price between roughly $3.20 and $3.35, with one of the largest concentrations around the $3.25-$3.30 zone.
A sustained move through that area could trigger another wave of forced short liquidations, potentially accelerating momentum toward the $3.40 level.
On the downside, the nearest major liquidation cluster sits around $2.80-$2.90, which could become the first area where buyers attempt to defend the trend if profit-taking emerges.
A decisive break above $3.25 could expose the $3.40 region, while clearing that liquidity pocket would leave the previous swing area around $3.55-$3.60 as the next technical zone to watch.
Conversely, losing support near $3.00 could increase the likelihood of a deeper pullback toward the $2.80-$2.90 range, where the liquidation heatmap indicates another significant pool of liquidity.

Solana targets $120 as ETF inflows and network activity rise

XRP holds its 200 day EMA: why bulls may still have a shot at $1.90

Here’s why Bittensor (TAO), Near Protocol, and Venice Token rising

Is Chainlink price heading to $15 after its latest breakout?

Why is HYPE stalling near $90 even as ETF inflows refuse to turn negative?
No results found
Loading articles...
Failed to load articles. Please try again.