
Why Bitcoin’s return to $64,650 could decide whether this recovery survives

AI Sentiment: 62/100 Bullish
This score is generated through AI-driven analysis of the article's content.

powered by

BTC is pressing the 50-day EMA resistance at $64,650 with fresh spot ETF inflows ($381.6m over two days) and improving risk sentiment from US-Iran deal hopes. Buy BTC now for a breakout: a daily close above $64,650 should flip momentum and open $67,079 (100-day EMA) then $72,649 (200-day EMA).
Key Risk: The $64,650 breakout fails and BTC loses $64,004, turning the recovery back into a sell-the-rip move.
Lower Fed-hike odds (58.9% vs 64.7%) and easing energy/geopolitical stress should weaken the dollar and support risk assets. Sell the USD using Invesco DB US Dollar Index Bullish Fund (UUP) short exposure (or buy inverse USD exposure) to ride the macro tailwind toward BTC and other risk trades.
Key Risk: A sudden jump in rate-hike expectations or a risk-off shock strengthens the dollar and crushes the trade.
- Bitcoin is bullish and approaching 50-day EMA resistance at $64,650.
- US spot Bitcoin ETFs recorded $211.50 million in inflows on Tuesday.
- Sustained break above $64,650 could send BTC toward $67,079 in near term.
Bitcoin BTC is trading near $64,100 on Wednesday as renewed institutional inflows and hopes for a diplomatic breakthrough between the United States and Iran support risk sentiment.
BTC is approaching a key resistance area around its 50-day Exponential Moving Average at $64,650.
A decisive break above this barrier could strengthen the recovery and open the way toward higher resistance levels.
US-Iran deal hopes improve risk sentiment
Investors remain hopeful that diplomatic negotiations could bring an end to the five-month conflict between the United States and Iran.
US Treasury Secretary Scott Bessent said Washington could reach an agreement with Tehran to reopen the Strait of Hormuz by Tuesday or Wednesday and move toward a more normalized position in the conflict.
Axios reported that the US, Iran and Oman were approaching an interim agreement, with US officials targeting a Wednesday announcement.
The proposed deal would reportedly establish a temporary 60-day arrangement between Oman and Iran in the Strait of Hormuz.
Reopening the waterway could reduce concerns about disruptions to global energy supplies and ease some of the geopolitical uncertainty weighing on financial markets.
OPEC+ decided on Sunday to increase oil production from September, further easing concerns about global supply constraints.
The decision pushed crude oil prices to their lowest level since June 13.
Lower oil prices could help reduce inflationary pressure and weaken expectations that the Federal Reserve will pursue additional monetary tightening.
The CME FedWatch Tool shows that markets are pricing in a 58.9% probability of a September interest-rate increase, down from 64.7% on Tuesday.
Declining rate-hike expectations can weaken demand for the US dollar and improve sentiment toward risk-sensitive assets such as Bitcoin.
Institutional demand for Bitcoin is showing signs of recovery after US-listed spot BTC ETFs recorded inflows for a second consecutive day.
CoinGlass ETF data shows the products attracted $211.50 million on Tuesday, following $170.09 million in net inflows on Monday. Combined inflows for the two sessions reached $381.58 million.
Continued ETF demand could provide additional support for Bitcoin by increasing institutional buying pressure.
However, the inflows would need to persist throughout the week to confirm a more durable improvement in demand.
Bitcoin technical outlook: BTC tests the 50-day EMA
Bitcoin is trading near $64,100 on Wednesday, slightly below the 50-day EMA at $64,650.
Despite the recent recovery, BTC retains a mildly bearish technical bias because it remains beneath several important moving averages.
The 100-day EMA at $67,079 and the 200-day EMA at $72,649 create a dense area of overhead resistance.
Until Bitcoin recovers these levels, its rebound could remain corrective within the broader downward structure.
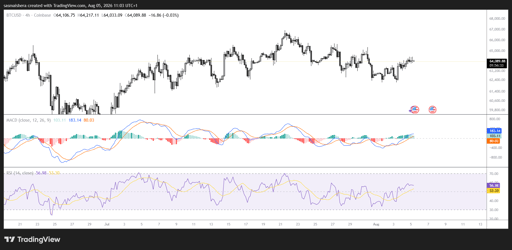
The Relative Strength Index stands near 53 on the 4-hour chart, indicating balanced momentum between buyers and sellers.
The Moving Average Convergence Divergence remains below the zero line, suggesting that underlying bearish pressure has not completely faded despite Bitcoin’s recent stabilization.
Together, the indicators show that BTC lacks a strong directional trend and requires a confirmed breakout to strengthen its bullish momentum.
Bitcoin faces immediate resistance at the 50-day EMA near $64,650.
A sustained daily close above this level would weaken the short-term bearish outlook and could open the way toward the 100-day EMA at $67,079.
If buying pressure continues, BTC could then target the 200-day EMA at $72,649.
On the downside, initial support is located at the horizontal level of $64,004.
Failure to defend this area would undermine the recovery and leave Bitcoin vulnerable to renewed selling pressure below its recent range.

PURR stock price forecast as Hyperliquid’s HYPE token hits a record high

Bitcoin ETFs keep buying, so why is BTC still stuck below $80K?

Why XRP traders are watching $1.47 as Evernorth and ETF demand build pressure

ENA explodes 10% as Ethena moves to kill its biggest token overhang

Can Ethereum price reclaim $2,500 as ETF demand battles profit-taking?
No results found
Loading articles...
Failed to load articles. Please try again.