
Ethereum price holds near $2,450 despite Fed pressure: Is $2,500 next?

AI Sentiment: 52/100 Neutral
This score is generated through AI-driven analysis of the article's content.

powered by

ETH is repeatedly rejecting below $2,500, but spot demand is still strong: US spot Ethereum ETFs just posted a 10-session inflow streak (~$1.42B). With staking deposits still heavy and no meaningful exit queue, supply pressure stays tight. Technicals show consolidation with support near the 200-hour EMA (~$2,425) and a range ceiling near $2,485–$2,500; a clean reclaim should trigger a move toward $2,550.
Key Risk: Fed turns more hawkish than priced and pushes yields/dollar higher, breaking $2,425 and forcing ETF inflows to reverse.
$2,500 is the clear supply zone: multiple failed attempts to hold above it. Short-term EMAs cluster around $2,448–$2,457, and the 1-hour momentum is compressed (no strong directional edge). Fade strength into $2,485–$2,500 with tight risk until ETH proves it can stay above the range ceiling.
Key Risk: ETH breaks and holds above $2,500 (and the upper Keltner boundary near ~$2,485–$2,500), turning the failed resistance into support and squeezing shorts toward $2,550.
- ETH holding near $2,440 as $2,500 resistance stalls short-term rally.
- Spot ETH ETFs logged a 10-day inflow streak totaling over $1.5 billion.
- Hawkish Fed commentary and rising Treasury yields pressure crypto markets.
Ethereum ETH has fallen roughly 0.8% over the past 24 hours to around $2,450 on Aug. 31, holding above $2,400 after another attempt to stay above $2,500 failed.
CoinGecko data showed ETH briefly pushing above $2,520 before falling towards $2,410 and recovering into the $2,430s.
The latest drop leaves the token down roughly 0.6% over seven days, although it remains up 27.2% over 14 days and 29.4% over the past month.
Selling around $2,500 has repeatedly stopped Ethereum from extending its August gains.
ETH traded near $1,918 on Aug. 18 before breaking sharply higher, leaving traders with sizeable short-term profits as the price moved into the $2,500 area.
Macro conditions have also become less favourable for crypto following Federal Reserve Chair Kevin Warsh's Aug. 28 speech at Jackson Hole.
Warsh said the Fed could have more work to do if policymakers could not gain confidence that inflation was returning towards the central bank's 2% target.
Rate markets subsequently put the probability of a September increase at roughly 57%, while the two-year Treasury yield climbed to around 4.33%.
The dollar also traded near a two-week high on Aug. 31, increasing pressure on risk assets.
Oil prices added to the inflation concerns after renewed fighting between the US and Iran.
Brent crude rose 3.2% to $90.97 per barrel on Monday as Asian equities declined and bond yields remained elevated.
Ethereum-specific demand has remained strong despite the tougher macro environment.
US spot Ethereum ETFs recorded $225.8 million in net inflows on Aug. 27, their strongest session in 10 months, extending a nine-session inflow streak to roughly $1.42 billion.
The funds added another $102.1 million on Aug. 28, extending the run to a tenth positive session.
The daily figures show that ETF demand has continued even while ETH has struggled to establish itself above $2,500.
Ethereum's staking queue remains heavily tilted towards new deposits, with 42.4 million ETH, or 34.8% of supply, already staked, according to Validator Queue.
Another 2.1 million ETH is waiting to enter staking, carrying an estimated wait of more than 36 days, while the validator exit queue currently has no ETH waiting to leave.
The US Treasury will also increase its longer-dated nominal bond buybacks in September, doubling the maximum purchase size from $2 billion to $4 billion per operation.
Announced on Aug. 19, the higher limit will apply from Sept. 9 through Nov. 4.
ETH price analysis
Ethereum (ETH) is trading near $2,441 after failing to sustain its latest momentum above the key $2,500 resistance zone.
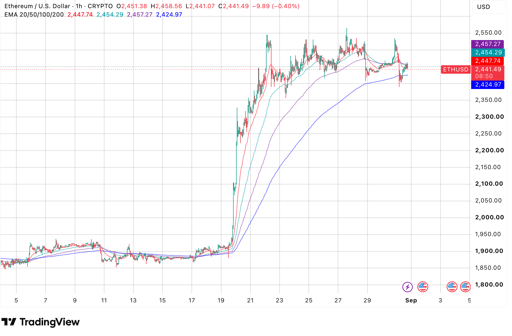
On the 1-hour chart, price action shows ETH pulling back below multiple short-term exponential moving averages (EMAs).
The 20-hour EMA stands at $2,447.74, while the 50-hour EMA sits at $2,454.29 and the 100-hour EMA sits at $2,457.27, forming a tight cluster of immediate overhead resistance.
The 200-hour EMA around $2,424.97 continues to act as crucial downside support, preserving the broader structure established during the mid-August rally.
From a volatility perspective, the 1-hour Keltner Channel highlights tightening price bands.
ETH has slipped below the channel midpoint of $2,447.74 toward the lower boundary near $2,410.32.
The upper boundary near $2,485.17 marks the upper constraint of the current consolidation range, which must be cleared to reopen a path toward $2,500 and higher extension targets near $2,550.
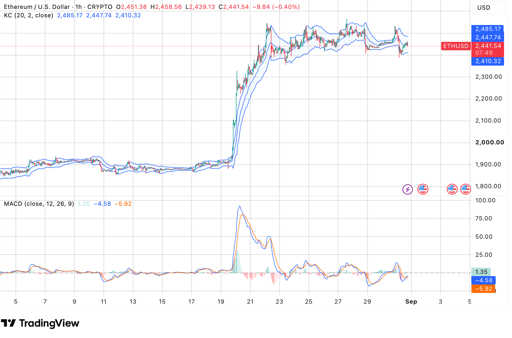
Momentum indicators point to a period of consolidation.
The 1-hour MACD line is recorded at -4.58 against a signal line of -5.92, leaving the histogram marginally positive at 1.35.
This compressed reading suggests that strong directional bias remains absent on shorter timeframes as buyers and sellers seek a clear breakout catalyst.

Why is Bitcoin price down today?

PURR stock price forecast as Hyperliquid’s HYPE token hits a record high

Bitcoin ETFs keep buying, so why is BTC still stuck below $80K?

Why XRP traders are watching $1.47 as Evernorth and ETF demand build pressure

ENA explodes 10% as Ethena moves to kill its biggest token overhang
No results found
Loading articles...
Failed to load articles. Please try again.