
Can Bitcoin price reach $80,000 after its latest breakout?

AI Sentiment: 72/100 Bullish
This score is generated through AI-driven analysis of the article's content.

powered by

Breakout is being driven by real catalysts: softer US employment lowering Fed-hike odds, easing Treasury yields, and fresh spot ETF inflows (IBIT leading). Technicals back it: strong trend (ADX ~43), positive DMI, and CMF > 0 showing the move has funding behind it. Upside path is a daily close above $80,000 targeting $81,500–$82,000.
Key Risk: A hot jobs print or renewed rate-hike repricing that sends Treasury yields back up and kills ETF inflow momentum.
News flow is BTC-specific: spot BTC ETFs saw net inflows while ETH ETFs saw net outflows, and the institutional access headline is for BTC and ETH but the market reaction is clearly favoring BTC. Second-order effect: capital rotates from ETH to BTC when macro rates and ETF flows tighten the “risk-on” basket toward the most liquid winner. Trade the relative underperformance by shorting ETH/BTC.
Key Risk: ETH catches up on its own catalyst (ETF/flows reversal or a broad crypto risk rally) and the ETH/BTC downtrend breaks.
- Bitcoin rose toward $78,000 as weak US jobs data lowered Fed rate hike expectations.
- Spot Bitcoin ETFs returned to inflows with about $101 million on Sept. 2.
- A break above $80,000 could put $82,800 and $85,000 in focus.
Bitcoin price BTC has risen 2.3% over the past 24 hours to roughly $78,500, breaking above $78,000 as softer US employment figures, fresh spot ETF inflows, and lower Treasury yields have supported demand for BTC.
ADP reported that US private employers added 38,000 jobs in August, below market expectations of roughly 47,000 and the weakest increase in seven months.
The reading has become the main catalyst behind Bitcoin’s move as traders reassess the likelihood of another Federal Reserve rate increase.
The probability of a 25 basis point rate rise at the Fed’s Sept. 15–16 meeting fell to roughly 62% from more than 67% a day earlier, according to CME FedWatch data.
Lower expectations for another increase in borrowing costs have coincided with Bitcoin moving from below $77,000 to above $78,000.
Friday’s US nonfarm payrolls report will provide the next major reading on the labour market.
A second weak employment print could further change expectations around the September Fed decision.
US Treasury yields have also eased after recently weighing on risk assets.
The 10 year Treasury yield fell roughly four basis points to 4.74%, while the two year yield dropped around six basis points to 4.32%.
Reuters reported that global markets steadied as Treasury yields retreated from multi year highs and oil prices stabilised.
Institutional flows turned positive at the same time. US spot Bitcoin exchange-traded funds recorded approximately $101.15 million in net inflows on Sept. 2, reversing roughly $236.5 million in net outflows during the previous session.
BlackRock’s IBIT accounted for approximately $115.45 million of the daily inflows.
Ethereum, Solana and XRP ETFs recorded net outflows during the same session, leaving Bitcoin as the main beneficiary of institutional crypto fund flows for the day.
Buyers also stepped in close to a cost basis tracked by Bitfinex analysts. Their estimate placed the average cost basis of active Bitcoin investors at approximately $76,350.
BTC dropped to roughly $76,400 before recovering, putting the local low within around $50 of the estimated level.
Standard Chartered added another crypto-specific development on Sept. 3 by launching institutional spot Bitcoin and Ether trading in the UAE.
The bank became the first global systemically important bank to offer the service in the country, giving eligible institutional clients access to deliverable BTC and ETH through its existing electronic trading infrastructure.
Clients can settle trades using a custodian of their choice, extending institutional access to Bitcoin through traditional banking infrastructure.
BTC price analysis
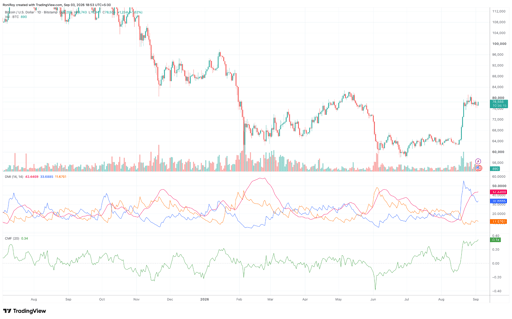
Bitcoin’s daily chart has moved sharply higher from the $60,000–$64,000 range established through June, July, and much of August, with the latest breakout carrying BTC above $76,000 before price reached the $78,000–$80,000 region. See below.
BTC/USD 1-day price chart. Source: TradingView.
BTC is now trading near $78,500 after encountering selling pressure below $80,000.
The Directional Movement Index supports the breakout but also shows why $80,000 remains important.
The positive directional indicator stands at 33.69, comfortably above the negative directional indicator at 11.68, showing that buying pressure currently exceeds selling pressure.
The ADX reading of 43.45 is well above 25, confirming that the current trend has considerable strength.
A daily close above $80,000 would clear the immediate psychological resistance and could put the May swing area around $81,500–$82,000 back in play.
Failure to hold the breakout area would leave $76,000–$76,400 as an important support zone, close to the active investor cost basis identified by Bitfinex.
Chaikin Money Flow has climbed to 0.34, its strongest positive reading visible on the daily chart in months.
A CMF reading substantially above zero means buying pressure has accompanied the price breakout, reducing the likelihood that the move above $76,000 has occurred on price momentum alone.
If CMF begins falling towards zero while BTC remains unable to clear $80,000, the divergence would weaken the case for an immediate move towards $82,000.
The 4-hour chart shows BTC consolidating after its rapid move from roughly $64,000 into the upper $70,000s. See below.
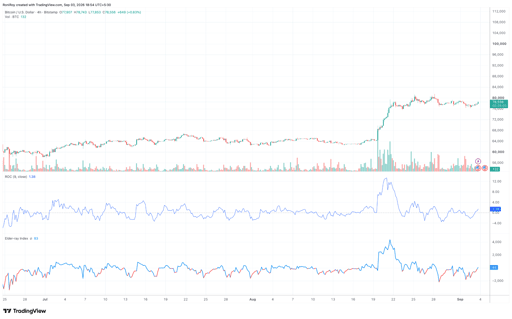
Price has spent several sessions largely between $76,000 and $80,000, while repeated attempts to move through the upper end of the range have stalled.
The nine-period Rate of Change has returned to 1.38% after falling sharply from the double-digit reading recorded during the initial breakout.
Momentum has therefore cooled from the first leg higher without turning negative.
ROC moving decisively above its recent local peaks while BTC clears $80,000 would support a move towards $81,500–$82,000, while a fall below zero alongside a loss of $77,000 would increase the probability of a retest of $76,000–$76,400.
The Elder Ray Index is also positive at 83, after recovering from negative territory.
Buyers have regained control on the 4-hour timeframe, although the current reading remains far below the spike recorded when Bitcoin initially broke above $70,000.
A continued rise in the index alongside a break above $80,000 would confirm increasing buying pressure.
Meanwhile, Bitcoin’s 24-hour liquidation heatmap shows a dense concentration of leveraged positions around $78,800–$79,000, followed by liquidity around and above $80,000. See below.
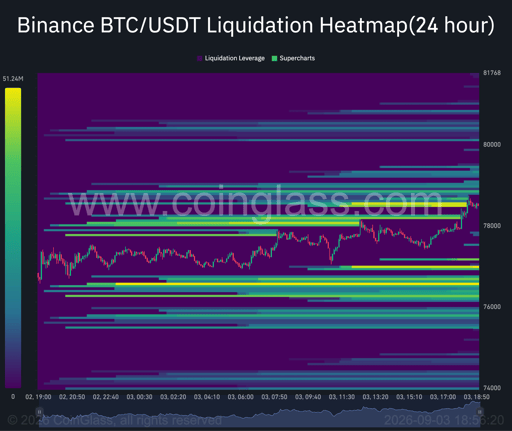
If BTC clears $79,000, liquidations in that region could help carry price towards the $80,000 level.
On the downside, another large liquidity concentration sits around $76,400–$76,800, overlapping with the active investor cost basis near $76,350.
A rejection below $80,000 followed by a break under $77,000 could therefore pull BTC towards that zone, while a loss of $76,000 would expose the next chart support around $74,000–$75,000.

Bahrain leads the Middle East stablecoin race, but where are the coins?

Could ADA rip past $0.21 as Cardano governance turns from risk to catalyst?

XRP has 11 days of ETF inflows, but is that enough to break the $1.40 ceiling?

XRP dips to $1.32 despite 11-day spot ETF inflow streak

How high can PI price go as Protocol 27 upgrade nears?
No results found
Loading articles...
Failed to load articles. Please try again.