
Bitcoin is flashing a warning near $78,000: is the market missing it?

AI Sentiment: 58/100 Bullish
This score is generated through AI-driven analysis of the article's content.

powered by

Buy spot Bitcoin (BTC) or BTC futures with a tight focus on the $77,000 floor. The article flags repeated defense of ~$77k, BTC still above major EMAs, and RSI ~58 (cooling but not broken). If CPI/Fed don’t reprice rates higher, the “Greed” backdrop plus consolidation support should fuel another push back toward the upper range near $78k+.
Key Risk: BTC breaks and holds below $77,000, triggering a trend deterioration toward the 200-day EMA (~$72.9k).
Sell Ethereum (ETH) versus Bitcoin (sell ETH/BTC). ETH is slipping toward ~$2,470 while BTC is consolidating above key moving averages; that points to weaker relative demand. If macro/energy-driven risk-off hits, ETH typically underperforms BTC first. Use ETH/BTC as the instrument to isolate the relative weakness rather than betting on the whole crypto tape.
Key Risk: ETH catches up sharply—rates fall on CPI/Fed and ETH beta reasserts, pushing ETH/BTC back up.
- Bitcoin fell below $78,000 as ETH and XRP followed the broader market correction.
- Middle East tensions and rising crude oil prices are weighing on risk appetite.
- BTC’s main downside support zone lies between approximately $72,764 and $72,923.
Cryptocurrency prices moved lower on Thursday as Bitcoin BTC retreated to test support near $78,000.
Major altcoins followed the market leader, with Ethereum (ETH) slipping toward $2,470 and XRP declining to approximately $1.37.
Despite the broad pullback, investor appetite for risk remains relatively strong. The Crypto Fear & Greed Index rose to 70 from 66, keeping market sentiment firmly in “Greed” territory.
Sustained optimism could support another breakout, although macroeconomic and geopolitical risks may fuel near-term volatility.
Bitcoin consolidation signals a lasting market repricing
Bitcoin has traded within a relatively narrow range over the past two weeks while repeatedly defending support near $77,000.
Currently, Bitcoin is testing the upper portion of its consolidation range rather than threatening to break below its floor.
The market’s ability to absorb a sharp move without reversing suggests that investors have genuinely reassessed Bitcoin’s value.
However, BTC must continue holding its key support levels for the constructive outlook to remain intact.
Escalating tensions in the Middle East are contributing to cautious market conditions.
Iran-backed Houthi forces have expanded their attacks on Saudi Arabia’s energy infrastructure and shipping vessels in the Red Sea.
The escalation has pushed crude oil prices higher and encouraged investors to reduce their exposure to risk-sensitive assets.
Bitcoin and other cryptocurrencies could face additional selling pressure if the conflict worsens or rising energy costs intensify concerns about inflation.
US CPI and Fed decision could trigger volatility
Investors are also preparing for Friday’s US Consumer Price Index report and the Federal Reserve’s monetary policy decision on Wednesday.
Bitcoin remains sensitive to changes in interest-rate expectations.
Recent dovish signals from the Fed initially supported prices, but strong employment data later reversed the move and left BTC broadly unchanged for the week.
According to K33 Research, the Producer Price Index, CPI report, and upcoming Federal Open Market Committee meeting are key volatility catalysts.
The September 15 Senate cloture vote on the CLARITY Act also represents a major crypto-specific event.
Inflation data that supports lower interest rates could lift Bitcoin and the broader cryptocurrency market.
Conversely, stronger-than-expected readings may reinforce expectations that monetary policy will remain restrictive.
Bitcoin holds above major moving averages
Bitcoin is trading below $78,000 on Thursday and has maintained a broadly bullish technical structure despite its latest pullback.
BTC remains above its major exponential moving averages, indicating that the wider uptrend is still intact.
However, momentum indicators point to a period of consolidation rather than an immediate breakout.
The Relative Strength Index has fallen from overbought territory to approximately 58. This signals that buying momentum has cooled but remains moderately positive.
Meanwhile, the Moving Average Convergence Divergence indicator has moved deeper into negative territory, highlighting fading upside pressure and the possibility of further range-bound trading.
Bitcoin is trading just slightly below the support at $78,094, with the $77,000 region serving as an important near-term floor.
If sellers push BTC below this area, the 200-day EMA at approximately $72,923 and the 50-day EMA near $72,764 form a concentrated demand zone.
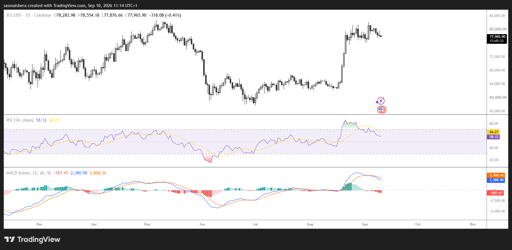
These closely positioned moving averages could attract buyers seeking exposure at lower prices.
The 100-day EMA around $70,727 represents the next major structural support. A decisive break below that level would signal a more significant deterioration in Bitcoin’s broader trend.
For the bullish case to strengthen, the MACD would need to stabilize while the RSI begins moving higher again.
Such a shift could indicate that momentum is returning and prepare Bitcoin for another attempt to extend its advance.

Cardano slides 3% as futures volume declines to $652M

Ethereum falls below $2,500: is this pullback setting up the next ETH surge?

Solana price at risk of falling below $100 as bearish momentum builds

XRP price prediction amid RLUSD stablecoin and ETF tailwinds

Zcash jumps 51% in a week: is Grayscale’s ETF fuelling a bigger breakout?
No results found
Loading articles...
Failed to load articles. Please try again.