Crude drops 14% in May as peace hopes outweigh supply fears

AI Sentiment: 35/100 Bearish
This score is generated through AI-driven analysis of the article's content.
powered by
Buy WTI via USOIL (or long WTI front-month) as a tactical hedge against inventory-driven upside. The article flags ongoing US inventory declines and distillate at a 21-year low; a further draw in the upcoming DOE data can trigger sharp upside even if the macro/geopolitical tone stays mixed. This is a “physical evidence” trade: if inventories keep falling, the market’s mild downside bias can flip fast.
Key Risk: DOE inventory data shows a surprise build (or demand destruction accelerates), proving the tightness is not real and WTI resumes the broader downtrend.
Sell/short Brent front-month. May showed “peace hope” headlines repeatedly crushed the war premium, and June starts below the 20/50-day averages with downside momentum. Until shipping through Hormuz is actually restored and physical tightness eases, rallies are likely to be sold in this choppy regime. Key catalyst to stay short: any further diplomatic progress without matching inventory/supply confirmation.
Key Risk: A confirmed, operational US–Iran framework that quickly restores Strait of Hormuz traffic and visibly eases physical tightness (inventories stop drawing, spreads compress).
- Brent crude falls 14.5% to $94.40 in May amid ceasefire hopes.
- Prices swung from $115 peak to near $92 low during the month.
- June expected volatile with mild downside bias on Iran talks.
Oil prices in May experienced extreme volatility as uncertainty about the US-Iran ceasefire kept the market on edge.
Even as Brent crude prices had climbed more than $110 per barrel earlier this month, the benchmark contract could not sustain the high levels for long.
Crude futures cooled in May as hopes for a US–Iran deal and weaker demand expectations trimmed the war premium, leaving Brent and West Texas Intermediate down roughly 14% for the month but still at historically elevated levels.
Monthly performance and volatility
Brent front‑month futures fell $16.00 from the April 30 settlement to $94.40 a barrel, a decline of 14.5% during May, while West Texas Intermediate lost $14.48, settling at $90.59, down 13.8% for the month.
Intraday extremes captured the month’s mood with Brent peaking at $115.30 on May 4 and hitting a low near $91.73 on May 29, with WTI mirroring that swing by topping $107.46 and sliding to $87.77 late in the month.
These moves reflect a shift from a one‑way “supply panic” trade to a more complex “peace hope versus physical shortage” regime, according to an arbatcapital.com report.
Hopes for a US–Iran framework pushed Brent below $92 a barrel this week for the first time since mid‑April.
The price had earlier climbed on reciprocal strikes, but news on May 28 of a 60‑day ceasefire extension sent crude tumbling further.
Unrestricted shipping through the Strait of Hormuz is also reportedly part of the agreement.
Negotiations on Iran’s nuclear program are set to continue in the coming weeks. However, approval from US President Trump is still pending, and Iran has not yet confirmed the alleged agreement.
As has been the case over the past three months, developments in the Persian Gulf are driving the ups and downs of oil prices, and this is unlikely to change much for the time being.
Peace hopes, physical tightness and demand worries
May’s sell‑off was driven by repeated headlines suggesting progress on a US–Iran framework that briefly reduced the extreme war premium, even as the physical market remained tight.
Traders pared some of the highest risk premia as optimism about restoring shipping through the Strait of Hormuz grew, but visible demand destruction and weaker macro signals capped rallies.
The result was high structural volatility, average true ranges above $5 per barrel, and a market that now treats rallies as likely to be sold unless confirmed by tangible physical tightening.
In May, Iran was also forced to significantly reduce its output because the US naval blockade restricted exports.
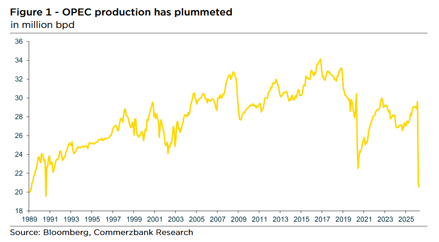
The International Energy Agency estimated the decline in production at 1.4 million barrels per day.
In addition, the United Arab Emirates withdrew from the OPEC+ cartel on May 1, further reducing the cartel’s reported aggregate production level.
“Regardless of the current production losses, the remaining seven countries of the OPEC+ cartel, which are meeting virtually on the first weekend of June, are likely to formally increase their production quotas further,” Lambrecht said.
While these are currently of little relevance, an increase would essentially provide more flexibility as soon as the Strait of Hormuz reopens and production can be ramped up again.
Price context and averages
Despite the late‑month slide, monthly average settlements remained elevated by historical standards for oil.
Brent’s monthly average was about $103.95 per barrel and WTI’s $98.77 a barrel, underscoring that May’s intra‑month volatility still left prices well above multi‑year norms, according to the arbatcapital.com report.
US spot price data and the weekly Energy Information Administration series show the same pattern of elevated but oscillating levels through May.
Technically, crude futures will enter June in a weaker momentum posture: both Brent and WTI traded below their 20‑day and 50‑day moving averages, with short‑term momentum indicators signaling room for further downside unless physical indicators flip.
The base case for June is a wide, volatile range with a mild downside bias, with the decisive variable being whether any draft US–Iran framework becomes operational and actually restores commercial traffic, according to arbatcapital.com.
Implications for markets and consumers
The May pattern of sharp rallies on supply‑shock headlines followed by steep retracements on diplomatic optimism means energy markets remain highly sensitive to geopolitical newsflow.
For refiners, traders, and oil‑importing economies, the month’s outcome reduces the immediate risk premium but leaves price uncertainty elevated, complicating budgeting and hedging decisions.
US and global monthly price series show that while headline volatility fell from early‑May peaks, average price levels still pose inflationary risks for energy‑dependent sectors.
May marked a transition from panic to a more nuanced market regime: prices fell sharply from early‑month highs but stayed historically high, volatility remained elevated, and the market now requires concrete physical evidence—restored shipping, inventory draws, or confirmed supply outages—to sustain rallies.
Absent that, traders are likely to treat future upside moves with skepticism, keeping crude markets choppy into June.
In addition, the US Department of Energy will release the weekly US inventory data in the middle of next week.
The trend shows inventories are declining, as was the case last week. US gasoline inventories are already significantly lower than usual for this time of year, and US distillate inventories are at a 21-year low.
“A further drawdown would support prices,” Lambrecht said.

Here’s why WTI crude oil price is falling amid US, Israel, Iran strikes

Europe’s fuel supply resilient but fragile as Middle East flows collapse

Silver price forecast: death cross nears ahead of US inflation data

Gold price loses crucial support ahead of US CPI data: will it crash to $4,000?
Citi trims 3-month gold target to $4,000 on softer demand
No results found
Loading articles...
Failed to load articles. Please try again.