Ethereum stalls near $2,300: is a big move brewing?

AI Sentiment: 38/100 Bearish
This score is generated through AI-driven analysis of the article's content.
powered by
Buy ETH on a breakout: enter only if ETH/USD holds above $2,423 (daily close or strong reclaim) and targets $2,500 first, then $2,746. Rationale: resistance at $2,423 is the gate; staked supply (31.5%) and LIDO’s large share support longer-term dip-buying, while institutional accumulation is still present. The negative funding/OI drop signals positioning is light—so a clean break can squeeze shorts and re-accelerate momentum.
Key Risk: ETH fails to hold $2,423 and rolls back below $2,325, proving the “breakout” was just a bounce.
Sell/short ETH if it breaks support: enter on a decisive move below $2,325 with follow-through, targeting $2,305 then $2,240. Rationale: sellers are currently in control (OI-weighted funding negative) and momentum is fading (RSI ~51, MACD near neutral). The article flags a likely retest of lower supports if $2,325 can’t be defended.
Key Risk: ETH quickly reclaims $2,325 and turns it into support, invalidating the bearish continuation.
- Ether has failed to take out $2,423 resistance and is now trading below $2,320.
- Mixed derivatives data suggest that traders are still cautious with market conditions.
- Bulls could reclaim control if the buyers hold the $2,240 support level.
Ether’s price action mirrors that of Bitcoin over the last few hours.
Similar to Bitcoin, Ether rallied to the $2,404 level during the late hours of Sunday but failed to take out the resistance level at $2,423.
The leading altcoin has been trading sideways over the past few days.
With the support level still holding, the bulls could push Ether’s price higher in the near term.
Ether sale and mixed derivatives data
Ether is down by less than 1% in the last 24 hours and is now trading at $2,318 per coin.
The bearish performance comes after it failed to take out the $2,423 resistance level a few hours ago.
The Ethereum Foundation recently sold 10,000 ETH to BitMine.
This transaction has drawn attention due to ongoing concerns over potential selling pressure linked to Foundation-related movements.
The latest on-chain data reveals that 31.5% of the total ETH supply, equivalent to 39.2 million ETH, is now staked.
A significant portion of the stake Ether (23%) is managed through LIDO.
Furthermore, on-chain activity has shown selective institutional accumulation, though price action has remained under broader selling pressure.
Over the next few days, Ether could trade within a $2,325 to $2,415 range, corresponding to a typical volatility band around current levels.
A bullish outcome would require sustained trading above immediate resistance ($2,423) and the upper end of the range.
A bearish scenario would occur if prices slip below $2,325 and test lower supports.
The derivatives data also show a mixed market reaction at the moment.
CoinGlass’s futures Open Interest (OI) for Ether now reads $31.79 billion, down 1% from the $32.3 billion recorded on Sunday.
The declining OI suggests that investors have reduced their exposure to the market.
Ethereum’s OI-Weighted Funding Rate also flipped negative on Monday and now reads -0.0019%.
The metric flipping negative indicates that the sellers are currently in control of the market.
Ethereum’s fundamentals remain constructive as institutional accumulation continues despite recent selling activity by the Ethereum Foundation.
The high percentage of staked ETH and LIDO’s role are supportive factors for long-term sentiment.
However, the short-term price action remains constrained by mixed momentum and resistance above $2,415.
Ether faces resistance from longer-term averages
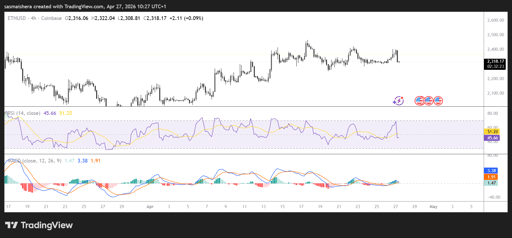
The ETH/USD 4-hour chart remains bearish and efficient as the market retraces from its recent rally.
However, Ether is trading above the 20-day and 50-day EMAs at $2,305 and $2,180, respectively.
The 200-day EMA at $2,780 remains a major resistance level that continues to cap upside recovery.
Momentum indicators suggest that the buyers are slowly losing control in the near term.
The MACD lines are close to the neutral zone, suggesting a fading bullish momentum.
The RSI of 51 is also near the neutral zone, adding further confluence to the growing selling pressure.
If the buyers regain control, initial resistance would be met at the $2,423 swing high.
A daily close above this level would allow the bulls to push towards the $2,500 psychological level before targeting $2,746 resistance for the first time since January.
On the downside, immediate support at $2,305 could allow the buyers to step in.
Failure to defend this level could expose the $2,240 support zone in the near term.

Why is Ethereum falling after briefly breaking above the $1,930 level?

OKX (OKB) slides 2% amid crypto sell-off: key levels to watch

BNB price outlook: Binance Coin targets $647 as bullish pattern takes shape

US moves $297M in seized crypto to Coinbase Prime despite no-sell vow

Lido DAO explodes 12% as governance vote sends traders rushing into LDO
No results found
Loading articles...
Failed to load articles. Please try again.