Can ADA climb above $0.30 as Open Interest surges sharply?

AI Sentiment: 68/100 Bullish
This score is generated through AI-driven analysis of the article's content.
powered by
Buy ADA now for a push through $0.30. The article shows rising futures Open Interest ($568.96M vs $450M) and funding rates flipped positive and jumped to ~0.0040%, which historically lines up with sharp rallies. Technicals back it: RSI ~62 on the 4-hour, MACD histogram positive, and price holding above the 50-day EMA (~$0.25) and key Fib support (~$0.26). Upside targets: $0.30 first, then $0.32–$0.35 if a daily close clears resistance.
Key Risk: Funding flips back negative and OI stops rising—meaning the new money is gone and the rally fails.
Buy call exposure via ADA options (e.g., 2–6 week calls) targeting a daily close above $0.30. This monetizes the derivatives setup: longs paying shorts (positive funding) plus increasing OI, which usually means volatility expands upward as price breaks resistance. Strike selection: near $0.30 with premium sized for a move to $0.32–$0.35.
Key Risk: A fast rejection at $0.28–$0.30 that drags implied volatility down and price back below $0.26.
- ADA is trading slightly lower on Monday after surging by more than 13% last week.
- Cardano's derivatives data points to mild bullish sentiment among traders.
- ADA could rally towards $0.30 psychological level if $0.26 support holds.
The cryptocurrency market is having a mixed start to the week as some major coins are in the green while others are bearish.
Bitcoin, the leading cryptocurrency by market cap, has dropped below $81,000 and is up by less than 1% in the last 24 hours.
Meanwhile, Cardano’s ADA is up by 3%, making it one of the best performers among the top 20 cryptocurrencies by market cap.
ADA has dropped to the $0.2700 region on Monday after rallying over 13% the previous week.
Despite the short-term pause, derivatives data show mild bullish positioning among traders.
The momentum indicators also suggest that the upward move could extend in the near term if the key support levels remain intact.
Cardano’s derivatives show a mild bullish bias
ADA surged by 13% last week and is now the 11th-largest cryptocurrency by market cap, surpassing Zcash.
CryptoQuant summary data suggests a broadly neutral outlook for Cardano, with most metrics showing subdued activity and little directional conviction among market participants, as shown below.
However, the derivatives data suggest a mild bullish outlook among Cardano traders.
According to CoinGlass, the futures’ Open Interest (OI) at exchanges in ADA surges to $568.96 million on Monday from $450 million on May 4 and has been rising steadily since mid-April.
The rising OI shows that new or additional money is entering the market, which could fuel a rally in ADA’s price.
Furthermore, Cardano’s funding rates flipped positive on May 4 and surged to 0.0040% on Monday. This indicates that the longs are paying the shorts.
Historically, when the funding rates have flipped from negative to positive and risen, the ADA price has rallied sharply.
Cardano price forecast
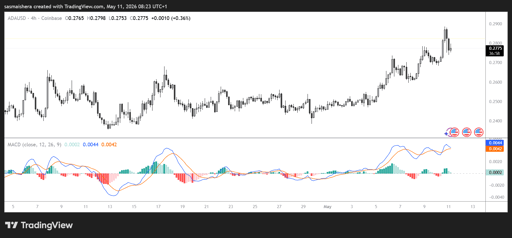
The ADA/USD 4-hour chart remains bearish despite the recent rally.
ADA is currently trading at $0.2775, above the 50-day Exponential Moving Average (EMA) at $0.25 and the 23.6% Fibonacci retracement at $0.26.
The momentum indicators show that the bulls remain in control.
The Relative Strength Index (RSI) on the 4-hour chart around 62 tilts bullish but shy of overbought territory.
Meanwhile, the Moving Average Convergence Divergence (MACD) histogram remains positive.
The two indicators suggest that buyers retain control despite notable overhead supply from higher moving averages and Fibonacci levels.
If the rally resumes, initial resistance would be seen at the 100-day EMA near $0.28, with a more significant cap at the horizontal barrier around $0.30.
A daily candle close above these levels would expose the 50% retracements at $0.32 and the 61.8% level at $0.35, ahead of the 200-day EMA near $0.36 and higher Fibonacci resistance toward $0.38 and the broader downtrend line.
However, if the bearish correction persists, immediate support would be encountered at the 23.6% retracements around $0.26, followed by the 50-day EMA at $0.25.
A daily candle close below this level would bring the horizontal floor at $0.24 into view, with the prior swing low near $0.22 acting as a more distant support zone.

Zcash price prediction: Why ZEC could reclaim $500 and climb to $550

Bitcoin Cash price outlook: BCH tracks BTC Higher, but can the rally continue?

Uniswap price prediction: UNI eyes $3.58 as Robinhood Chain fuels optimism

Can Dogecoin hold $0.07 as Iran shock keeps crypto traders nervous?

Solana bulls defend $76 as fading inflows threaten another breakdown
No results found
Loading articles...
Failed to load articles. Please try again.