LAB token jumps 57% in a week as whales pile into long positions

AI Sentiment: 78/100 Bullish
This score is generated through AI-driven analysis of the article's content.
powered by
Buy LAB spot. Whale wallets are net adding longs (long-to-short ~260%), LAB defended $9–$10, and trend signals are strong (4H above 20/50/100/200 EMAs; daily ADX ~46). Momentum plus whale positioning makes a push toward $15–$16 likely, with upside to $20 if it clears that band.
Key Risk: Whales start dumping into strength and the token loses the $13 support zone, turning this rally into a fast reversal.
Buy LAB/USDT on a trend basis (use a tight risk level under $13). The market is already showing a developing uptrend: RSI ~60 and bullish EMA stacking on 4H. If price holds above $13, the next magnet is $15–$16; if it breaks, momentum traders will chase.
Key Risk: A sudden momentum break—price closes back below the $13 area—signals the uptrend failed and forces liquidation/stop-outs.
- Whale buying is helping support LAB's recent recovery rally.
- Momentum indicators remain constructive as RSI trades above 60.
- Price is holding above all major EMAs in a bullish alignment.
LAB has extended its rally to a sixth consecutive day, climbing about 57% over the past week as whale buying, technical momentum, and renewed interest in the project's ecosystem pushed the token back toward the $14 level.
Data from CoinGecko showed LAB trading near $13.91 on June 17, up nearly 40% over the past 24 hours and more than 57% over the previous seven days.
The move comes after the token spent much of early June under pressure following a steep correction from its June 2 all-time high of $27.30.
According to market commentator Alastar, whale wallets added roughly $540,000 in long positions within an hour as LAB continued its advance.
Data shared by the trader showed 129 whale long positions against 85 short positions, with total long exposure reaching $27.58 million compared with $10.58 million in short exposure.
The same data showed a whale long-to-short ratio of 260.67%, while net whale buying volume during the previous hour stood near $490,000 against approximately $179,000 in net selling.
Alastar described the $13 region as a key level to monitor, noting that larger holders could begin reducing positions around that area because many long positions were already sitting on substantial unrealised profits.
Recent buying activity arrived after LAB successfully defended support between $9 and $10, a zone that attracted dip buyers after weeks of selling pressure.
Market participants also closed bearish positions as momentum indicators improved, helping fuel a rapid recovery from the June lows.
Speculative interest around the project has also remained active.
LAB operates as a multi-chain AI trading terminal connecting Ethereum, Solana, and BNB Chain, while community discussions have focused on the rollout of its mobile application and ongoing work tied to prediction market features.
LAB price analysis
Technical indicators continue to show improving conditions despite the token remaining well below its all-time high.
On the daily chart, LAB's Relative Strength Index stood near 60.7, recovering from lower levels seen during the correction.
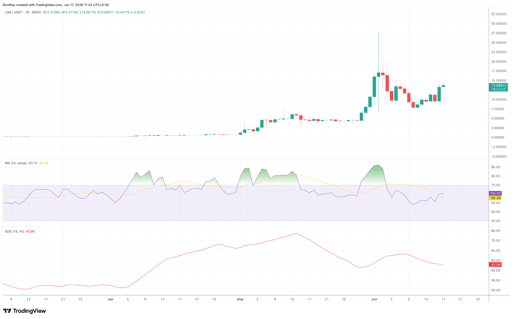
LAB/USDT 1-day price chart. Source: TradingView.
The indicator has moved above its signal line, suggesting momentum has strengthened alongside the recent price advance.
The Average Directional Index, or ADX, was close to 46 on the daily timeframe.
An ADX reading above 25 is generally associated with a strong trend, indicating that the current move has developed beyond a brief price bounce.
On the 4-hour timeframe, LAB is trading above its 20, 50, 100 and 200-period exponential moving averages.
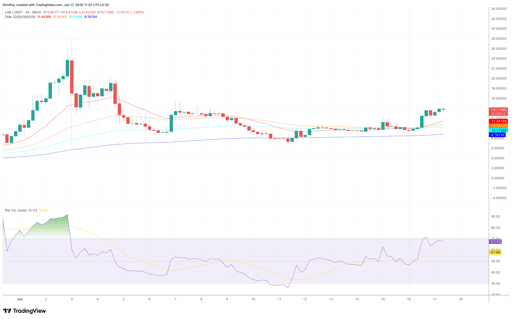
LAB/USDT 4-hour price chart. Source: TradingView.
The 20-day EMA sits above the 50-day EMA, which remains above both the 100-day and 200-day EMAs.
Traders often view that alignment as evidence of a developing uptrend.
Even so, the recovery still faces significant hurdles before any retest of the record high becomes a realistic discussion.
LAB currently trades roughly 50% below its June peak, leaving several resistance levels between current prices and the previous top.
The area between $15 and $16 stands out as the next major test. A sustained move above that range could open the door to a challenge of the $20 level.
Failure to hold recent gains, however, could send attention back toward support around $13 and the rising 20-day EMA near $11.4.
Questions surrounding token distribution also remain in focus as selling pressure had intensified earlier this month after on-chain observers identified early wallets transferring large amounts of tokens to centralised exchanges.
Investor caution has also been shaped by the project's future token unlock schedule, with roughly 282 million tokens still locked and expected to enter circulation over time.
As of press time, LAB's six-day rally has restored bullish momentum, but whether the token can continue climbing may depend on whether buyers can absorb future profit-taking while maintaining support above recently reclaimed levels.

Top crypto price predictions: Venice Token, Worldcoin, XLM

HYPE hits new all-time high: can Hyperliquid’s rally extend toward $90?

Top 3 risks that may derail the crypto market rally

Uniswap price pumps after a bullish forecast despite the Hyperliquid threat

Why Filecoin price could drop to $0.76 after losing the multi-month $0.80 support
No results found
Loading articles...
Failed to load articles. Please try again.