XRP price at crossroads as RLUSD growth battles weak technical signals

AI Sentiment: 35/100 Bearish
This score is generated through AI-driven analysis of the article's content.
powered by
Buy XRP via spot XRP ETFs on pullbacks, betting on RLUSD adoption and ETF inflows to overpower weak technicals. The article flags muted Wednesday inflows but meaningful buys on Monday/Tuesday, and RLUSD integration (Flutterwave + Squid) expands real payment use cases. Entry on weakness toward $1.1258; add if it reclaims $1.24–$1.30.
Key Risk: ETF inflows stay weak and XRP fails to reclaim $1.24–$1.30, confirming the downtrend continuation.
Sell XRP (spot or perpetuals) into the $1.24–$1.30 resistance band where it’s rejecting and where the 50/100-day EMAs sit. Derivatives are mildly bearish: negative OI-weighted funding (-0.0090%) and a negative long-to-short tilt (0.9369) suggest shorts are favored and upside is capped. Target a move back to $1.1258, then $1.05 if $1.1258 breaks.
Key Risk: XRP gets a daily close above $1.30 and holds, flipping momentum and forcing shorts to cover.
- XRP remains weak near $1.17 with bearish derivatives, strong resistance levels.
- Spot XRP ETFs continue to attract inflows despite the price decline.
- XRP could reclaim $1.3 level if current support zone holds in the near term.
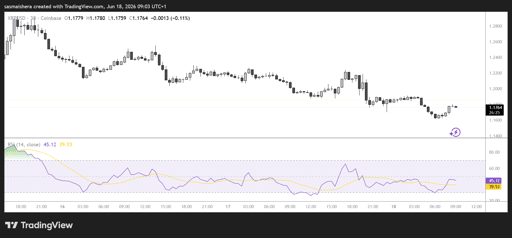
Ripple’s XRP is trading around $1.17 on Thursday after losing more than 3% of its value in the last 24 hours.
The cross-border coin is holding below the upper boundary of its falling channel after facing rejection at higher levels.
Despite a modest stabilization, XRP remains under pressure from broader technical resistance zones, and derivatives signals that point to cautious market sentiment.
Derivatives data signals bearish tilt for XRP
Market positioning data suggests a mildly bearish outlook for XRP.
CoinGlass metrics show that XRP’s OI-weighted funding rate has turned negative at -0.0090%, indicating that short positions are paying longs, a signal often associated with bearish sentiment.
Furthermore, the long-to-short ratio has also tilted negative (0.9369), reinforcing the view that traders remain cautious or positioned for further downside.
Together, these indicators suggest that upside momentum for XRP remains capped in the near term.
The futures Open Interest (OI) has also dropped to US$2.7 billion (approx. $4.7 billion) after hitting US$2.8 billion (approx. $4.9 billion) on Wednesday.
While the derivatives data remains bearish, institutional inflow could push XRP’s price higher in the near term.
According to CoinGlass’s ETF page, spot XRP ETF inflow was muted on Wednesday.
However, the funds pulled in 4.28 million XRP and 2.38 million XRP on Tuesday and Monday.
Ripple is expanding the adoption of its native RLUSD stablecoin.
Earlier this week, Ripple invested in Flutterwave’s US$3.2 billion (approx. $5.6 billion) Series E round to integrate RLUSD stablecoin and XRP Ledger technology into cross-border payments across Africa.
As part of the partnership, Flutterwave will integrate RLUSD into its payments infrastructure, enabling businesses to settle certain international transactions using digital dollars.
In addition to this, the cross-chain infrastructure platform Squid integrated Ripple’s RLUSD stablecoin.
The integration will enable users to swap into and out of RLUSD across more than 100 blockchains and over 20,000 digital assets through a single transaction.
These latest developments, alongside the continued inflow into XRP ETFs, could push XRP’s price higher in the near to medium term.
XRP technical outlook remains cautious
The XRP/USD 4-hour chart remains bullish despite the recent price retracements.
From a technical perspective, XRP continues to trade below its key moving averages, including the 50-day, 100-day, and 200-day EMAs at approximately $1.28, $1.37, and $1.58.
However, momentum indicators show early stabilization, with the Relative Strength Index (RSI) near 54 and MACD lines trending slightly higher.
However, these signals still reflect a corrective move within a broader downtrend.
If the bullish trend resumes today, immediate resistance sits between $1.24 and $1.30, aligning with the key moving averages.
A daily candle close above this zone could open room toward $1.37 and $1.58, while failure to reclaim it may expose XRP to renewed downside pressure.
However, if the bearish trend persists, XRP could extend its decline towards the first major support and the 4-hour TLQ level at $1.1258.
Failure to defend this level could see XRP dip lower and retest the swing low of $1.05 created on June 6.

PENGU price struggles after comic debut: why are traders selling?

Is XRP price at risk as Senate delays CLARITY Act vote?

CSPR price climbs 5%: can Casper extend its recovery?

Europe's 2026 digital identity deadline opens a $47 billion market

Will SHIB price crash as whales sell?
No results found
Loading articles...
Failed to load articles. Please try again.