Celestica stock analysis: Will the sell-off continue?

AI Sentiment: 58/100 Bullish
This score is generated through AI-driven analysis of the article's content.
powered by
Buy CLS. The news is a real capacity expansion ($300M Texas plant + new 343k sq ft) while CCS is already accelerating (Q1 revenue +53%) and management raised 2026 outlook to $19.0B revenue and $10.15 adj EPS. The sell-off looks more like AI/data-center sentiment whiplash than a demand break. Enter on weakness near the $517 area (50-day EMA) with a plan to add if it tests the $473 neckline.
Key Risk: AI/data-center customers cut orders or delay deployments, turning the raised outlook into a one-off and crushing forward growth.
Sell/short CLS if it confirms technical breakdown: a daily close below the $517 50-day EMA and especially below the $473 neckline. That would align with the head-and-shoulders pattern and likely trigger momentum selling, with $400 as the next magnet.
Key Risk: Price reclaims $580 (right-shoulder level) and the market decides the investment + raised guidance outweighs the chart, forcing shorts to cover.
- Celestica stock retreated sharply in the past few weeks.
- The company announced a $300 million investment in in Texas.
- While growth continues, technicals suggest that it may struggle in the near term.
Celestica stock price has slumped in the past few weeks, falling from the all-time high of $655 in June to the current $524. This retreat continued today, even after the company announced a $300 million investment in Texas. So, is it safe to buy the dip?
Celestica announces a major US investment
Celestica, a top Canadian provider key products like storage, compute, and networking, made a major announcement today. It will expand its Texas plant and spend $300 million, a move that will create over 2,300 jobs in the next two years.
At the same time, the company plans to extend its lease in its existing buildings and is building a new 343k square-foot program.
This statement came at a time when Celestica’s business is booming, helped by the ongoing artificial intelligence (AI) boom and data center spending. Its top clients like Alphabet, Meta Platforms, Microsoft, Amazon, and Cisco are all spending billions of dollars in their data center.
Google, its biggest customer, is boosting its spending on its TPU, raising demand for its racks and other high-speed networking products. Earlier this month, it said that it planned to spend $80 billion more in AI.
The most recent results showed that its revenue jumped by 53% in the first quarter. It made $4.05 billion, close to the upper side of the $3.85 billion and $4.15 billion guidance.
Most of this revenue came from its Connectivity & Cloud Solutions (CCS), which is made up of its servers and storage products. In a statement, the CEO said:
“We continue to see accelerating growth from our CCS customer base, alongside increasing profitability in both our CCS and ATS segments. Driven by this momentum, we are raising our 2026 annual outlook to $19.0 billion in revenue and $10.15 in adjusted EPS.”
Celestica’s growth to continue amid strong data center spending
Wall Street analysts predict that the company has more room for growth amid the resilient data center spending. Data compiled by Yahoo Finance shows that analysts expect that its revenue will be $19.19 billion, higher than what analysts guided. If this happens, it will be a 54% annual growth rate.
Analysts expect that its revenue growth will be 40% next year to $26 billion, which will make it one of the fastest growing Canadian companies. Its EPS is expected to move from $6.05 last year to $10, followed by $15 next year.
Celestica stock price technical analysis
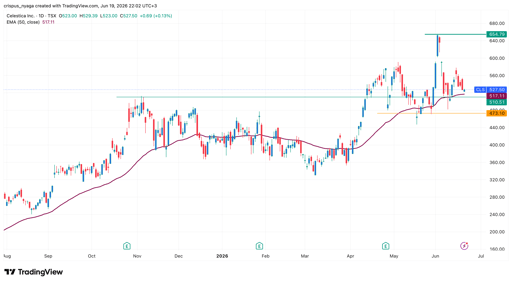
Celestica stock chart | Source: TradingView
The daily chart shows that the Celestica share price has retreated in the past few weeks. This retreat started after the recent Broadcom earnings, which pushed top AI companies lower.
A closer look shows that the stock has formed a head-and-shoulders pattern, a common bearish sign in technical analysis. The neckline is at $473, its lowest levels since May.
However, it sits above the 50-day Exponential Moving Averages (EMA), a sign that bulls are still hanging on there. Therefore, a drop below the 50-day moving average of $517 will confirm the bearish outlook.
If this happens, the next level to watch will be at $400. On the other hand, a move above the right shoulder level of $580 will invalidate the bearish outlook.

Qualcomm stock slips as memory crunch hits Q2 earnings

Microsoft beats Q4 estimates as Azure cloud growth tops expectations

Meta stock sinks as Q2 earnings disappoint on multiple fronts

Dow sinks 1,100 points as Fed holds rates, chip stocks extend losses

Evening Digest: Fed holds rates, Trump warns Iran as oil surges
No results found
Loading articles...
Failed to load articles. Please try again.