
Are Ethereum bulls preparing a major breakout above the 100-day EMA?

AI Sentiment: 72/100 Bullish
This score is generated through AI-driven analysis of the article's content.

powered by

Buy Ethereum (ETH) spot for a push through $1,938 (100-day EMA). The setup is tight: exchange outflows + higher staking reduce sell pressure, while futures volume is surging and funding is positive (longs paying shorts), which supports a breakout attempt. Momentum is improving (MACD positive) and ETH is holding above the 50-day EMA (~$1,818), keeping the recovery intact. Upside path: $1,938 first, then $2,000, and a daily close above $1,938 opens $2,180 (200-day EMA).
Key Risk: ETH loses the $1,818 50-day EMA and the exchange-outflow story reverses, turning the breakout into a failed rally.
Sell ETH perpetual futures (short perps) as a tactical hedge against a crowded breakout. Futures volume is up 110% and funding is positive, but the long-to-short ratio is still below 1 (0.96), meaning positioning is not fully one-sided—perfect for a squeeze-and-reversal if price stalls at $1,938. Trade the rejection risk: short near $1,938–$2,000 and cover on a drop back below $1,818.
Key Risk: ETH cleanly breaks and holds above $1,938 with daily closes, forcing shorts to cover and driving ETH toward $2,180.
- ETH remains above its 50-day EMA, signaling improving short-term momentum.
- The technical indicators, RSI and MACD, continue to support a bullish outlook.
- Immediate resistance lies at 1,938, followed by the $2,000 psychological level.
Ethereum is the best performer among the top 10 cryptocurrencies by market cap over the last seven days.
The coin is up by 3% during that period, and it now consolidates around the $1,850 resistance level.
Technical indicators suggest that Ethereum remains neutral, with derivatives data painting a bullish picture.
Exchange outflows and retail participation could push ETH’s price higher
The primary catalyst behind Ethereum’s recent rally is the outflow of ETH tokens from exchanges.
According to CryptoQuant, Ethereum has experienced notable exchange outflows paired with increased staking activity and substantial stablecoin inflows to Binance, indicating shifts in supply and demand dynamics and tightening immediate liquidity.
Such movements can affect market conditions by reducing the circulating ETH supply on exchanges and increasing on-chain participation.
In addition to that, retail participation for Ethereum is increasing. According to CoinGlass data, the futures volume is up 110% in the last 24 hours and now reads $31.32 billion.
Furthermore, the funding rate reads 0.0076%. A positive funding rate indicates that long positions are paying the shorts, suggesting a bullish scenario.
However, the long-to-short ratio of 0.96 suggests that the bulls are not completely in control of the market at the moment.
Ethereum price outlook: ETH holds above key support as recovery gains momentum
Ethereum (ETH) traded near $1,860 on Monday, extending last week's recovery after climbing 4% over the previous seven days.
The second-largest cryptocurrency continues to hold above its 50-day Exponential Moving Average (EMA), suggesting buyers are maintaining control in the short term.
However, ETH still faces significant resistance from longer-term moving averages that continue to define the broader bearish trend.
Ethereum is currently trading above its 50-day EMA at approximately $1,818, a technical level often viewed as an indicator of improving short-term market sentiment.
Maintaining support above this moving average suggests buyers remain active, helping preserve the recent recovery.
Despite this strength, Ethereum remains below the 100-day EMA at $1,938 and the 200-day EMA at $2,180
These longer-term trend indicators continue to act as major resistance levels and must be reclaimed before a stronger bullish reversal can be confirmed.
Technical indicators suggest bullish momentum is gradually building. The Relative Strength Index (RSI) is hovering near 50, indicating a neutral bias among traders.
Meanwhile, the Moving Average Convergence Divergence (MACD) remains in positive territory, signaling that upward momentum is continuing to strengthen.
Although both indicators favor further gains, Ethereum still faces several important resistance levels before the broader trend shifts decisively higher.
If buyers maintain control, Ethereum could target the first major resistance at $1,938 (100-day EMA), ahead of the $2,000 psychological area.
A daily candle close above these levels could pave the way for an extended rally towards the 200-day EMA at $2,180.
Reclaiming the 200-day EMA would signal a more meaningful medium-term trend reversal.
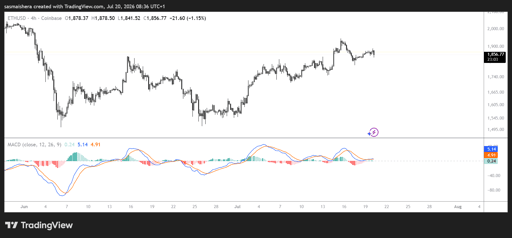
On the downside, Ethereum's first line of defense remains at the 50-day EMA of $1,818. If selling pressure intensifies and ETH loses this support, the next major support zone is located near $1,385.
This level is expected to attract renewed buying interest if the current recovery weakens.

Bahrain leads the Middle East stablecoin race, but where are the coins?

Could ADA rip past $0.21 as Cardano governance turns from risk to catalyst?

XRP has 11 days of ETF inflows, but is that enough to break the $1.40 ceiling?

XRP dips to $1.32 despite 11-day spot ETF inflow streak

How high can PI price go as Protocol 27 upgrade nears?
No results found
Loading articles...
Failed to load articles. Please try again.