
Here’s why wheat prices are soaring this year

AI Sentiment: 82/100 Bullish
This score is generated through AI-driven analysis of the article's content.

powered by

Buy CBOT Wheat futures (front-month). Supply is tightening (WASDE cut US supplies; lowest US output since 1970/71) while demand rises, and the Russia-Ukraine conflict is disrupting Black Sea exports. The chart setup (50-day EMA break, cup-and-handle, bullish pennant) supports continuation toward 750 cents.
Key Risk: A fast, credible de-escalation or shipping normalization that restores Black Sea wheat flow and forces prices to mean-revert.
Buy WEAT as a liquid way to express the same thesis. It captures the expected grind higher in wheat prices from supply risk (weather + war) and momentum signals, without needing to time futures roll risk. Target is continued upside through the next major resistance zone near 750 cents in the underlying.
Key Risk: A global demand shock (recession/consumption drop) that overwhelms supply fears and collapses the wheat risk premium.
- Wheat prices have jumped by over 20% from the June lows.
- The surge has accelerated amid the ongoing Russia-Ukraine war.
- The recent WASDE report pointed to a wheat supply decline.
Wheat prices continued rising this week as concerns about supply escalated. The most active futures in Chicago jumped to 683.2 cents per bushel, up by 20% from the lowest level in June this year. Technicals and the ongoing Russia-Ukraine conflict suggest that prices may continue soaring.
Russia-Ukraine war boosts wheat prices
Wheat prices have been in a strong comeback this year, rising by 35% since January and 40% above its lowest level last year.
The surge escalated because of the ongoing weather-related risks and the fighting between Ukraine and Russia.
The two sides have embraced drone warfare and are actively targeting key infrastructure. Ukraine has bombed several Russian ships in the Black Sea, where Russia exports most of its wheat. Russia has also responded by launching drone attacks against Ukraine.
Worse, there is a risk that the crisis will escalate in the coming months as the two sides are not in active discussions on how to end the war. Attempts by President Donald Trump to negotiate the end of the war have not succeeded.
Russia and Ukraine are two of the biggest wheat exporters in the world. Estimates are that the typical annual wheat production in Russia is nearly 90 million metric tons, while Ukraine produces nearly 30 million a year. Russia accounts for about 10%, while Ukraine accounts for about 3% of the total wheat production.
All this is happening amid weather concerns, especially in Europe, where a heat wave has killed hundreds of people. The European Union collectively produces over 136 million metric tons of wheat a year.
The most recent World Agricultural Supply and Demand Estimates (WASDE) report reduced US supplies by 22 million bushels, citing lower beginning stocks and production. It estimated that its production will be about 1,536 million bushels, down 7 million from a month earlier. If this is correct, it will be the lowest US wheat production since 1970/71.
The same trend is happening globally, where the report estimated that supplies will fall. It estimates that supplies will be about 1,099.1 million, with Canada’s production falling further. While Russia and Ukraine's production is expected to jump this year, getting it to the market will be difficult because of the drone attacks.
Wheat demand continues to rise globally. The WASDE report noted that global consumption would jump to 826 million tonnes. As such, a situation where demand is rising as supplies falls often leads to higher prices.
Wheat price technical analysis
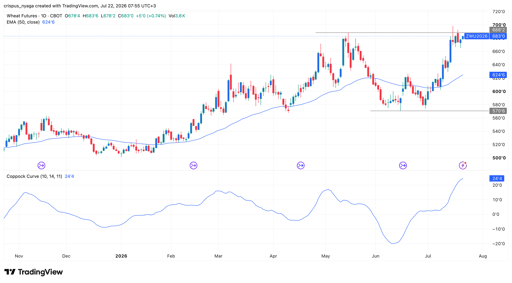
Wheat price chart | Source: TradingView
The daily chart shows that wheat price has rebounded in the past few weeks, moving from a low of 570 cents to 683 today. It has crossed the 50-day Exponential Moving Average (EMA).
The price has formed a cup-and-handle pattern, which often leads to a continuation. It is also forming a bullish pennant pattern, which consists of a vertical line and a triangle.
The Cappock Curve indicator has jumped to the highest level in months, a sign that it has the momentum. Therefore, the price will likely continue rising as the Russia-Ukraine conflict escalates. If this happens, the next key level to watch will be at 750 cents.

Nio stock: Why Tesla rival dropped despite strong revenue growth

Nvidia stock analysis: top reasons why the shares may go parabolic soon

Broadcom stock falls to a key support: is it about to surge after earnings?

Oil jumps above $91, but the market’s biggest Hormuz fear has changed

Gold price sinks near two-week low: could US jobs data trigger the next crash?
No results found
Loading articles...
Failed to load articles. Please try again.