
Nikkei 225 Index wavers as Japan bond yields and tech stocks rise

AI Sentiment: 72/100 Bullish
This score is generated through AI-driven analysis of the article's content.

powered by

Buy Nikkei 225 exposure (e.g., iShares Nikkei 225 ETF, EWJ). Yen weakness + widening Japan–US rate spread keeps supporting exporters, while the index is holding above the 50/100-day EMAs and has a falling-wedge setup. Upside target is a break above the wedge toward ¥72,845; the article flags ¥62,646 as the key invalidation level.
Key Risk: Yen reverses sharply (BoJ turns hawkish or Fed hike odds fall), crushing exporter earnings and breaking the wedge support.
Buy Tokyo Electron and Advantest. The news flow is already lifting semis/memory on the back of a weaker yen and strong export data; these names are high beta to global tech capex and benefit disproportionately when the yen falls. Use the recent double-digit rebound as confirmation, and add on any continued strength into US earnings season.
Key Risk: US tech earnings/capex guidance disappoints (or semis de-rate), overpowering the yen tailwind and reversing the rally.
- The Nikkei 225 Index has rebounded by 6.3% from this month’s low.
- The Japanese yen is trading at the lowest level in decades.
- Japanese bond yields have continued rising this month.
The Nikkei 225 Index rose modestly as traders bought the recent dip and as the Japanese yen continued declining against the US dollar. It was trading at 66,550, up by 6.30% from its lowest point this month.
Japanese yen and government bonds slip
The Nikkei 225 Index rose a bit as investors reacted to the performance of the Japanese yen and government bonds.
The Japanese yen has slumped to the lowest level in decades as investors predicted that the Federal Reserve will hike interest rates later this year. Odds of a rate hike jumped to 66% on Polymarket as the ongoing US-Iran war pushed crude oil prices higher.
At the same time, many market participants predict that the Bank of Japan (BoJ) will not hike interest rates soon. A poll shows that the bank will delay until December to hike interest rates. This means that the spread between Japan and US rates will continue to widen.
Companies in the Nikkei 225 Index react differently to the deteriorating yen. Big exporters benefit when the yen is falling. Indeed, data released on Wednesday showed that the country’s exports jumped by 19.3% in June after growing by 16.8% in the previous month.
This increase was better than the median estimate of 18.6%. Imports jumped by 25.4%, more than double the previous month’s growth.
Meanwhile, Japanese government bonds continued their sell-off. The five-year yield jumped to 1.99%, a few points below the year-to-date high of 2.07%. Ten-year yields rose to 2.756%.
The recent Nikkei 225 Index rebound has been driven by memory and semiconductor companies. Kioxia stock jumped to ¥69,400, up by 27% from its lowest level this month. Other memory companies like Samsung and SK Hynix have also jumped recently.
Softbank stock has risen to ¥5,860, while Tokyo Electron and Advantest have all soared by double digits in the past few weeks.
Looking forward, the Nikkei 225 Index will react to the ongoing US earnings season. Alphabet reported strong numbers on Wednesday, but its stock dropped as the management hiked its capital expenditure plans.
More US companies like Intel, T-Mobile, RTX, Blackstone, and Union Pacific will publish their numbers. Japanese companies like Sumitomo Mitsui, Chugai Pharma, and Shin-etsu Chemical will release their numbers this week.
Nikkei 225 Index technical analysis
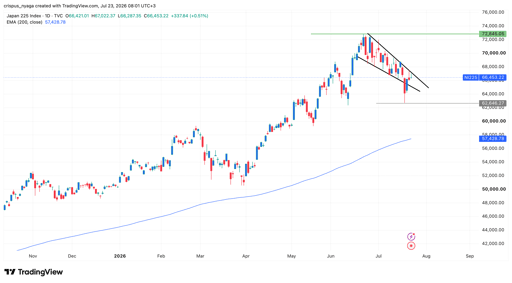
Ni225 Index chart | Source: TradingView
The daily chart shows that the Nikkei 225 Index bottomed at ¥62,646 on July 17 and then bounced back to the current ¥66,550. It has formed a large falling wedge pattern, which is made up of two descending and converging trendlines.
The index has also remained above the 50-day and 100-day Exponential Moving Averages (EMA). This performance is a sign that bulls remain in control.
Therefore, a move above the upper side of the wedge pattern will point to more gains, possibly to the year-to-date high of ¥72,845. A drop below the key support level of ¥62,646 will invalidate the bullish forecast.

Brent crude oil price forecast: targets $100 as US-Iran war escalates

Kospi jumps 3% as Asian markets chase Alphabet’s $200B AI splurge

Tesla stock sinks 4% after Q2 earnings: has Elon Musk’s AI pivot gone too far?

Jim Cramer dubs Intel a ‘miracle stock’ ahead of earnings

USD/JPY forecast: what next for the falling Japanese yen?
No results found
Loading articles...
Failed to load articles. Please try again.
