
Bitcoin got the inflation report it wanted: why is BTC still falling?

AI Sentiment: 28/100 Bearish
This score is generated through AI-driven analysis of the article's content.

powered by

Sell BTC (BTC-USD) into the bearish technical setup after the CPI “good news” failed to spark follow-through. The report reduced hike odds, but price action stayed weak and BTC is below key moving averages with RSI 42 and negative MACD—classic momentum failure. Target a break below $63,000, then $62,185; if it extends, $61,228.
Key Risk: A Jackson Hole/Fed tone turns clearly dovish and BTC reclaims $64,430/$65,423, flipping momentum back to buyers.
Sell ETH (ETH-USD) versus BTC by fading altcoin beta. The article notes altcoins fell more than BTC even as CPI eased rate fears—suggesting risk appetite is still fragile. If BTC breaks $63k, ETH typically underperforms on the way down; target a faster move lower than BTC.
Key Risk: ETH decouples upward on a risk-on rotation (or a specific ETH catalyst) and outperforms BTC despite BTC weakness.
- BTC fell toward $63,500 on Thursday, extending its weekly decline to almost 2%.
- July’s CPI figures matched estimates, reducing fears of an immediate rate increase.
- Bitcoin could retest $61,228 support level if it declines below $63,000 soon.
Bitcoin BTC slipped toward $63,700 on Thursday as an in-line US inflation report eased some monetary-policy concerns but failed to generate enough momentum for a sustained cryptocurrency rally.
The leading cryptocurrency is down by less than 1%, with altcoins recording bigger losses during that period.
US inflation matches market expectations
The bearish performance comes as July’s US Consumer Price Index data arrived largely in line with economists’ forecasts.
Headline inflation increased 0.1% month over month and 3.4% annually. Core inflation, which excludes volatile food and energy prices, rose 0.2% on the month while easing to an annual rate of 2.5%.
The figures reduced the perceived likelihood of another Federal Reserve interest-rate increase in September.
Futures markets lowered the probability of a rate hike to approximately 38%, down from 46% before the report’s release.
Markets initially reacted positively. Gold rose 1.3%, ETH gained just over 1%, BTC climbed approximately 0.5%, and S&P 500 futures advanced 0.2%. However, the cryptocurrency gains proved short-lived.
In an email to Invezz, Maksym Sakharov, co-founder and CEO of the debanking infrastructure provider WeFi, stated that the softer print is welcome since the Fed will have more breathing room for deciding on a rate hike, but one release will not settle the argument over the inflation path due to pre-built volatility.
The bigger story was the positioning already built before the release. Economists were split enough to support bets in both directions, so the number was always going to leave one side exposed to liquidations, which subsequently trigger multiple rounds of volatility in the financial markets, especially crypto. The first market move says more about leverage than conviction. Until the Fed gives markets a clearer policy path, CPI days will keep producing sharp reversals and forced exits.
The report also contained details that could allow the Fed to remain patient. Shelter costs rose by only 0.1%, while energy prices declined 1.5% and gasoline fell 2.9%. Some goods categories are also beginning to move beyond the tariff-related price increases recorded during the previous year.
With the latest inflation report failing to deliver a decisive market signal, investors will turn their attention to several upcoming events.
Investors will now focus on the Federal Reserve’s Jackson Hole gathering later in August. The event could provide more clarity on policymakers’ economic outlook and the future direction of interest rates.
The US employment report scheduled for September 4 will offer another assessment of labor-market strength. That will be followed by the next inflation release on September 11.
Unexpected weakness in employment or inflation could improve expectations for looser monetary policy and provide support for risk-sensitive assets such as Bitcoin.
Bitcoin technical forecast: Will BTC drop below $63,000?
The BTC/USD 4-hour chart remains bearish and efficient as Bitcoin has underperformed over the past few days.
The leading cryptocurrency is trading below key moving averages, with the technical indicators pointing to further bearish action.
The RSI of 42 is below the neutral 50, indicating that the bears are increasing their control of the market.
The MACD lines are also within the negative territory, adding further confluence to the bearish narrative.
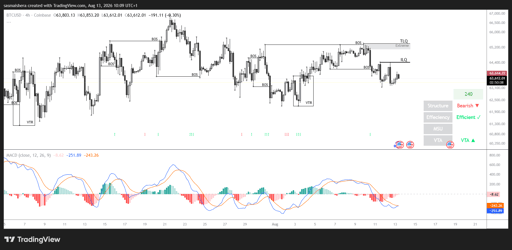
If the selloff continues, Bitcoin could drop below the $63,000 level and retest the August 3rd swing low of $62,185.
An extended bearish scenario could see BTC drop to the July 6 low of $61,228, with another major demand zone located at $57,659.
However, if the bulls regain control, Bitcoin will surge past the 4-hour Inducement Liquidity (ILQ) at $64,430 before retesting the resistance and TLQ level at $65,423.

How high can PI price go as Protocol 27 upgrade nears?

Bitcoin’s $82,000 test is coming as one major market signal turns bullish

Ethereum slips toward $2,400: key ETH levels to watch if support breaks

Can ARB price reach $0.14 after 30% rally powered by Robinhood chain?

BONK jumps 7% as rising futures demand supports a breakout attempt
No results found
Loading articles...
Failed to load articles. Please try again.