
Ethereum gains 25% as ETF demand strengthens after record $3B short wipeout

AI Sentiment: 72/100 Bullish
This score is generated through AI-driven analysis of the article's content.

powered by

ETH is breaking out after a historic ~$1.2B ETH short wipeout and is now getting fresh spot ETF demand ($219.5M net inflow Thursday). With ETH holding above the 200-day EMA (~$2,177) and the next resistance at ~$2,431, the setup favors a continuation move if inflows persist. Buy ETH spot or the US spot Ethereum ETF to ride the trend.
Key Risk: ETF inflows stall and ETH fails to hold above ~$2,177, triggering a fast unwind from crowded longs.
Funding is elevated (0.081%, highest since late May) and RSI/stoch are extreme (RSI ~85, stoch ~92). That’s a classic “crowded long” condition where price can whip down even if the longer-term trend is up. Short ETH perpetuals or reduce exposure when funding stays high into the ~$2,431 resistance test.
Key Risk: ETH cleanly breaks and holds above ~$2,431, forcing shorts to cover and pushing funding even higher.
- Ethereum has gained approximately 25% since Wednesday.
- Ethereum ETFs attracted $219.5M on Thursday amid institutional interest.
- ETH faces resistance at $2,431, while RSI of 85 signals overbought conditions.
Ethereum continued its strong rally Friday as institutional inflows, renewed derivatives activity, and whale accumulation supported prices following a historic wave of short liquidations.
ETH has climbed approximately 25% since Wednesday, pushing above several major technical indicators and bringing the $2,431 resistance level into focus.
Ethereum’s rally comes as Bitcoin added 21% to its value in the last few days to hit the $75,000 psychological level.
However, elevated funding rates, profit-taking, and new short positions suggest the rally could encounter volatility as traders weigh the possibility of a pullback.
Historic $3 billion short squeeze fuels Ethereum rally
The cryptocurrency market recorded approximately $3 billion in short liquidations Wednesday, marking its largest such liquidation event on record.
Ethereum accounted for roughly 40% of the total, representing approximately $1.2 billion in forced short-position closures.
The liquidation surge accelerated ETH’s upward move as bearish traders were compelled to close positions.
Open interest has increased by 5% to $31.67 billion on Friday as traders gradually return to the market.
Ethereum funding rates climbed to 0.081%, their highest level since late May, according to CoinGlass.
Positive funding rates generally indicate that traders holding long positions are paying those with short positions, reflecting stronger demand for bullish exposure.
The increase suggests market participants are positioning for further gains following Ethereum’s breakout.
However, elevated funding rates can also indicate increasingly crowded bullish trades, raising the risk of another rapid shift if prices reverse.
Institutional investors also supported Ethereum’s advance through renewed demand for spot exchange-traded funds.
US spot Ethereum ETFs recorded $219.50 million in net inflows Thursday, according to CoinGlass
The figure marked the largest single-day inflow since October and suggests institutional buyers are participating in the latest recovery.
Continued ETF inflows could strengthen the case for further upside, particularly if derivatives activity remains constructive and exchange withdrawals continue.
Ethereum faces resistance at $2,431
Ethereum’s technical outlook remains bullish after the token moved above its major exponential moving averages.
The 200-day EMA stands at $2,177, while the 50-day, 100-day, and 20-day EMAs are located at $1,961, $1,932, and $1,902.
Holding above these levels indicates that ETH has reclaimed important trend indicators following its recent advance.
The next major resistance level sits near $2,431. A sustained breakout above that barrier could open the door to additional gains.
However, momentum indicators suggest Ethereum may be approaching overheated conditions.
The 14-day relative strength index has climbed to 85, while the stochastic oscillator stands near 92.
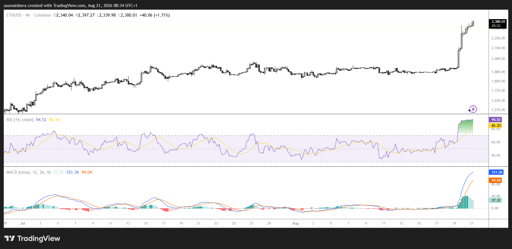
Both readings indicate an overbought market and raise the possibility of consolidation or a short-term correction.
If ETH retreats, initial support lies near the 200-day EMA at $2,177 and the nearby horizontal level at $2,172.
Additional support sits around $1,961, followed by the 100-day EMA at $1,932 and the 20-day EMA at $1,902. More substantial downside levels are located at $1,809, $1,701, and $1,507.

Is Ethereum price at risk of losing $2,400 as oil tops $105?

Cardano slides 3% as futures volume declines to $652M

Bitcoin is flashing a warning near $78,000: is the market missing it?

Ethereum falls below $2,500: is this pullback setting up the next ETH surge?

Solana price at risk of falling below $100 as bearish momentum builds
No results found
Loading articles...
Failed to load articles. Please try again.