
Is Dogecoin’s 34% rally just getting started, or is a pullback next?

AI Sentiment: 58/100 Bullish
This score is generated through AI-driven analysis of the article's content.

powered by

Buy Dogecoin (DOGE) spot for a continuation move. Setup: DOGE is still above the 50-day (~$0.076) and 100-day (~$0.081) EMAs and holding the near-term support band around $0.088. The ETF tape is turning positive (net inflows Monday), which can absorb some of the recent profit-taking. Bull case trigger: a clean break and hold above the 200-day EMA resistance near $0.094, opening $0.102 next.
Key Risk: Whales keep selling into strength and DOGE repeatedly rejects $0.094, then breaks $0.088 and slides toward the 100-day EMA (~$0.081).
Sell/short DOGE if it fails at the 200-day EMA. Setup: long-to-short is below 1 (bearish positioning), RSI is stretched (~60 on 4H), and large holders reduced balances since Friday—classic conditions for a pullback after a sharp rally. Bear trigger: rejection near $0.094 followed by loss of $0.088 support; downside path targets ~$0.081 (100-day EMA) then ~$0.076 (50-day EMA).
Key Risk: DOGE breaks above $0.094 and holds, forcing short-covering and turning the pullback thesis into a momentum squeeze.
- Dogecoin is trading around $0.091 after surging more than 34% last week.
- Spot Dogecoin ETFs recorded $146,020 in inflows Monday amid institutional demand.
- DOGE faces immediate resistance at $0.094, with a breakout targeting $0.102.
Dogecoin trades around $0.091 on Tuesday after gaining more than 34% last week.
The meme coin is approaching the 200-day Exponential Moving Average near $0.094, a technical level that could determine whether its recovery continues.
A breakout above that resistance would improve the outlook for further gains, while rejection could trigger profit-taking after the recent rally.
Institutional demand has shown modest improvement, but whale selling and cautious derivatives positioning suggest the market remains vulnerable to a short-term pullback.
Dogecoin ETFs record positive inflows
Institutional interest in Dogecoin has shown early signs of recovery. SoSoValue data indicates that spot Dogecoin ETFs recorded approximately $146,020 in net inflows Monday.
The latest inflow followed $653,420 in net inflows during the previous week.
Although modest relative to flows into larger cryptocurrency ETFs, the positive readings suggest renewed investor interest in DOGE.
Continued inflows could help support the rally if demand strengthens throughout the week.
However, the current figures remain too small to offset substantial selling pressure on their own.
Santiment’s Supply Distribution data shows that large Dogecoin holders have reduced their exposure since Friday.
Wallets holding between 1 million and 10 million DOGE and those holding between 10 million and 100 million DOGE have collectively reduced their balances by approximately 280 million tokens.
At a DOGE price of roughly $0.092, that amount is worth approximately $25.8 million. The distribution suggests some large investors are taking profits following last week’s 34% rally.
Continued whale selling could increase short-term supply and make it more difficult for DOGE to break through its nearby resistance levels.
Dogecoin’s derivatives market also points to increased caution. CoinGlass data shows the long-to-short ratio at 0.90 on Tuesday, near its lowest level in more than a month.
A reading below one indicates that bearish positions outnumber bullish positions. The ratio suggests traders are increasingly positioning for a pullback after the recent price surge.
However, derivatives sentiment can shift quickly if DOGE breaks above a major resistance level and forces short sellers to close their positions.
Dogecoin technical outlook: DOGE holds above major moving averages
Dogecoin’s broader technical structure remains positive despite signs of short-term caution.
The cryptocurrency trades above its 50-day EMA near $0.076 and its 100-day EMA around $0.081.
It also remains above a former descending resistance line near $0.070, which now acts as potential support.
These levels indicate that buyers retain control of the near-term trend as long as DOGE stays above its recent breakout areas.
The immediate support band sits near $0.088. Holding that level would help maintain the current bullish structure.
Momentum indicators show that Dogecoin’s recent advance may be stretched. The 4-hour Relative Strength Index stands near 60, suggesting that DOGE could soon enter overbought territory.
An RSI above 60 typically signals strong momentum, but it can also indicate that a rally is vulnerable to consolidation or profit-taking.
The Moving Average Convergence Divergence histogram remains positive and elevated, confirming that buying pressure is still present.
However, the combination of overbought conditions and whale selling suggests DOGE may need to pause before attempting another sustained move higher.
The 200-day EMA near $0.094 represents Dogecoin’s first major resistance level. A decisive break above that barrier would bring the next horizontal resistance near $0.102 into focus.
A daily close above $0.102 would strengthen the bullish structure and could support additional gains.
By contrast, repeated rejection near $0.094 would suggest the recent upswing is losing momentum.
The $0.100 psychological level may also attract profit-taking before DOGE reaches the higher resistance zone.
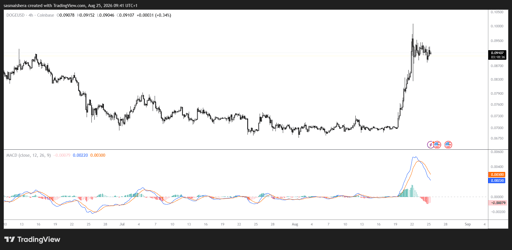
If Dogecoin pulls back, the first support level is near $0.088. A break below that area could expose the 100-day EMA around $0.081.
Further selling would place the 50-day EMA near $0.076 in focus, followed by the former downtrend resistance around $0.070.
For now, Dogecoin’s near-term outlook remains constructive above $0.088. However, a sustained move beyond $0.094 is needed to keep the $0.102 target in play.

Why is Injective price up 45% this week?

Polygon price erupts 50% as POL breakout sparks fresh $0.14 target

Ethereum price prediction: golden cross forms as ETF, staking inflows jump

Bitcoin rockets past $80K but one technical warning could spoil the breakout

XRP price prediction as Crypto Fear and Greed Index hits 83
No results found
Loading articles...
Failed to load articles. Please try again.