
SCHD nears title of biggest dividend ETF, but technical risks loom

AI Sentiment: 55/100 Neutral
This score is generated through AI-driven analysis of the article's content.

powered by

Buy SCHD. It’s at an all-time high with strong inflows (~$20B YTD) and remains above the 50/100-day EMAs, which supports trend continuation. The article flags a possible island reversal, but the bullish path is clear: a push through the upper channel would confirm strength and open room toward a $40 move.
Key Risk: SCHD breaks down from the upper channel and the island-reversal plays out, dragging it back to the ~$33.25 retest zone.
Sell VIG versus SCHD (short VIG, buy SCHD). The news says SCHD is close to overtaking VIG in size and has already added far more assets this year. If flows keep rotating into higher-yield dividend momentum, SCHD should keep outperforming VIG even if both are dividend ETFs.
Key Risk: VIG reasserts leadership as investors rotate back to steadier dividend quality, causing SCHD’s relative outperformance to fade.
- The SCHD ETF has jumped and outperformed the benchmark assets.
- Its inflows have jumped sharply this year, making it one of the top gainers.
- The risk, however, is that it has formed a bearish reversal pattern.
The Schwab US Dividend ETF (SCHD) has continued its strong rally this year, reaching a record high of $35.30, up 27% from where it started the year. This rally has allowed the fund to outperform popular indices such as the Dow Jones, Nasdaq 100, and S&P 500. The risk, however, is that it has also formed some alarming technical patterns that could trigger a brief reversal.
SCHD may become the biggest dividend ETF as inflows jump
The SCHD ETF is on track to become the biggest dividend funds in the world, helped by its strong inflows and performance. Data shows that the fund has added nearly $20 billion in assets this year, making it one of the best gainers in the ETF industry.
The fund now holds over $112 billion in assets, making it the second-biggest dividend ETF in the world after the Vanguard Dividend Appreciation (VIG), which has $113 billion in assets. As a result, there is a possibility that SCHD will overtake VIG as soon as this week.
The ongoing SCHD ETF surge has happened even though it tracks companies in traditional industries. Its biggest holdings are firms like Merck, Amgen, and Abbott Laboratories. Merck shares have jumped by over 40% this year, while Amgen has jumped by over 30%.
The other top companies in the fund are Coca-Cola, Chevron, Verizon Communications, and ConocoPhillips. It also holds large stakes in companies like Home Depot, Procter & Gamble, and UnitedHealth.
These companies show that the company has no direct stake in companies in the AI industry like Nvidia, Micron, and SanDisk, which have done well this year. Its performance is, therefore, because of the ongoing hedging as some investors predict that the AI bubble will pop.
Still, while the SCHD is beating the S&P 500 and Nasdaq 100 indices this year, it has a long record of underperforming. For example, its total return in the last five years stood at 62%, much lower than VOO’s and QQQ’s 80% and 91.4%, respectively.
SCHD ETF technical analysis: risky patterns are emerging
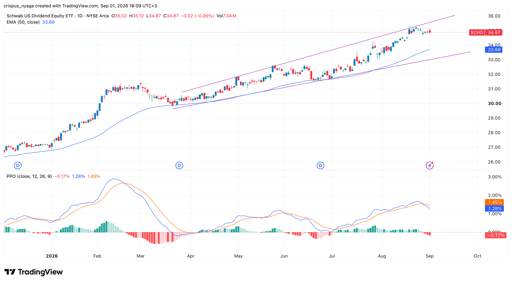
SCHD chart | Source: TradingView
The daily chart shows that the SCHD ETF has been in a strong rally this year and is now hovering at its all-time high. A closer look shows that it has formed an ascending channel and is now close to the upper side. In most cases, this ascending channel is usually a continuation sign in technical analysis.
The fund has remained above the 50-day and 100-day Exponential Moving Averages, a sign that bulls are in control for now.
The risk, however, is that it has formed a small island reversal pattern. This pattern forms when an asset gaps up and then consolidates for a while. It often results in a reversal.
At the same time the two lines of the Percentage Price Oscillator (PPO) have formed a bearish crossover and are pointing downwards. All this is happening near the upper side of the channel.
In most cases, an asset may continue rising or reverse. A surge to $40 will be confirmed if it moves above the upper side of the channel. The alternative is that it resumes the downward trend and retests the lower side of the channel at $33.25.
Why are Intel and AMD stocks falling today

Dell stock falls before earnings: strong AI demand will not alone sustain 250% rally

Amazon stock falls on FTC lawsuit but analysts bullish despite near-term pressure

Dow falls 250 pts as oil, Treasury yields rise and Fed rate hike bets grow

Nio stock: Why Tesla rival dropped despite strong revenue growth
No results found
Loading articles...
Failed to load articles. Please try again.