
Forget SCHD: Here’s why BWET ETF is up 1,720% this year

AI Sentiment: 62/100 Bullish
This score is generated through AI-driven analysis of the article's content.

powered by

Buy BWET. It’s up massively because tanker freight futures (1–6 month, mostly VLCC) are pricing in Middle East disruption and Strait of Hormuz bottlenecks. If the US–Iran situation stays tense, rates stay elevated and the futures roll keeps feeding performance. Key risk: a rapid de-escalation that frees traffic through Hormuz and crushes tanker spot/futures rates, forcing BWET’s futures curve to collapse.
Key Risk: US–Iran de-escalation that reopens Hormuz and drives tanker freight futures sharply lower.
Buy the underlying winners: VLCC/tanker operators like Euronav (EURN) and Frontline (FRO). The article notes shipping stocks are up ~68% this year, and higher freight rates typically translate into stronger earnings and cash flow for tanker owners. Key risk: freight rates fall faster than earnings catch up, leading to dividend/capital return cuts and a sharp multiple compression.
Key Risk: Freight rates reverse quickly, forcing earnings/dividends down and tanking stock valuations.
- The BWET ETF has jumped by 1,720% this year.
- It is benefiting from the soaring freight shipping rates.
- The crisis between the US and Iran and between Russia and Ukraine is escalated.
Investors have turned attention to the Schwab US Dividend ETF (SCHD) this year as it jumped to a record high, beating the benchmark funds tracking the Nasdaq 100 and S&P 500 indices. SCHD has jumped by 27% this year and is set to overtake the Vanguard Dividend Appreciation (VIG) fund.
Breakwave Tanker Shipping ETF is the best-performing fund this year
However, another smaller fund, known as the Breakwave Tanker Shipping ETF (BWET), is doing much better. It has jumped by over 1,718% this year, making it the best-performing fund in the United States. Its assets under management (AUM) has jumped to $119 million, while its expense ratio is a whopping 3.50%.
BWET has jumped because of the ongoing crisis in the Middle East that has pushd shipping prices to the highest level in years. This fund uses freight futures contracts to track movements in the tanker shipping rates. It does not invest in tanker companies.
READ MORE: SCHD nears title of biggest dividend ETF, but technical risks loom
BWET does that by investing in freight futures contracts of one-to-six months contracts, which have a weighted average expiration of between 60 and 90 days. 90% of these contracts are in Very Large Crude Carriers (VLCC), while the rest are on the Suezmax class.
Shipping prices have jumped sharply in the past few months, which has also helped push shipping companies to their record highs. A basket of 35 US and European-listed shipping stocks have soared by about 68% this year and 82% in the last 12 months.
Shipping costs continued rising this week after the US and Iran restarted their kinetic activity. On Thursday morning, Iran announced that it had launched several missile and drones towards Kuwait, a major US ally. It did that to retaliate against the recent attacks.
The ongoing crisis has led to a plunge in traffic through the Strait of Hormuz, which accounts for about 20% of the global oil shipments. Many ships are currently trapped near the strait, with operators hiking prices.
This trend may continue in the foreseeable future, especially if the crisis between the two countries escalates.
At the same time, the Russia-Ukraine war is continuing, with both sides targeting key shipping infrastructure. The two sides are expected to continue fighting now that negotiations have failed.
BWET ETF technical analysis
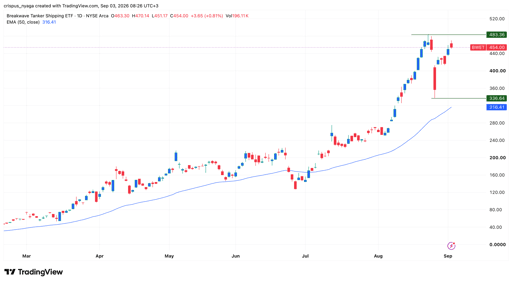
BWET ETF chart | Source: TradingView
The daily chart shows that the BWET ETF has soared in the past few months and is now hovering near its all-time high. It has remained above all moving averages and the Supertrend indicator.
The risk, however, is that the fund is forming a double-top pattern at $483 and a neckline at $336. A double-top is one of the most common bearish reversal patterns in technical analysis.
Therefore, there is a risk that the fund will drop unless bulls push it above the key resistance level at $483. A clear break above that level will point to more gains towards $500.

Dow rises 390 pts as US stocks gain despite oil, Fed and Iran concerns

Micron stock analysis as the AI Bubble Index sinks to a four-month low

HOOD stock price analysis as key Robinhood Chain metrics surge

Wall Street futures trade flat today: 5 things to know before the market opens

Alphabet kicks off September on positive note: is GOOG stock a buy after 10% slump?
No results found
Loading articles...
Failed to load articles. Please try again.