
Is Chainlink price heading to $15 after its latest breakout?

AI Sentiment: 78/100 Bullish
This score is generated through AI-driven analysis of the article's content.

powered by

Buy Chainlink (LINK) targeting $14 then $15–$15.50. The $12–$12.20 breakout held and price is now above key moving averages, with accumulation rising and volume expanding on the move. The Bottomline banking partnership plus Circle’s cirBTC Proof-of-Reserve and Wyoming’s stable-token reserve verification are concrete “real-world rails” catalysts that support follow-through, not just hype. Key risk: LINK fails to hold the $12–$12.20 breakout and quickly falls back below it, flipping momentum and dragging price toward the 20-day EMA (~$11.46).
Key Risk: Breakout fails—LINK loses $12–$12.20 and momentum reverses.
Sell/short Chainlink’s nearest “beneficiary” narrative in the short term: short LINK/USDT on any rejection near $13.68. If LINK can’t clear the recent high, the market will likely fade the breakout and rotate to broader crypto beta while the news impact is already priced. This is a tactical momentum trade: wait for a failed breakout at $13.68, then press the downside toward $12–$12.20. Key risk: LINK breaks and holds above $13.68, turning the rejection into a continuation move toward $14 and $15+.
Key Risk: LINK clears $13.68 and holds, turning the rejection into a breakout continuation.
- LINK has gained more than 8% in 24 hours after breaking above $12.
- Bottomline, Circle and Wyoming adoption have supported the move.
- LINK could target $14 and $15 if the breakout holds.
Chainlink price has climbed more than 8% over the past 24 hours to trade near $13.26, extending its seven-day gain to roughly 18% after LINK broke through the $12 resistance area.
CoinGecko puts LINK at $13.26 at the time of writing, after the token moved as high as roughly $13.66 during the latest push.
LINK has gained more than 10% from an intraday low near $12.12, while its 30-day gain has reached roughly 62%.
The move followed Chainlink's Sept. 3 strategic partnership with payments technology firm Bottomline, which serves more than 600 banks and processes over $16 trillion in payments each year.
Under the partnership, the companies plan to connect Chainlink infrastructure, including its Cross-Chain Interoperability Protocol, with existing banking payment systems for cross-border and cross-chain transactions.
LINK initially moved through the $12 area following the announcement before buyers pushed the token past $13 on Sept. 7.
The $12 to $12.20 region had repeatedly capped price in recent sessions, making the breakout an important part of the latest move.
Circle's launch of cirBTC has given Chainlink another live use case.
The wrapped Bitcoin product uses Chainlink Proof of Reserve to provide onchain verification of the Bitcoin reserves backing cirBTC, according to Circle.
Institutional adoption has extended to Wyoming, where the Wyoming Stable Token Commission selected Chainlink Proof of Reserve to provide near-real-time reserve verification for the state's Frontier Stable Token.
Wyoming had previously selected Chainlink CCIP as the exclusive cross-chain infrastructure for FRNT.
Chainlink has separately worked with the US Department of Commerce to bring official economic statistics onchain.
The integration makes Bureau of Economic Analysis figures, including real gross domestic product and the Personal Consumption Expenditures price index, available across supported blockchain networks.
LINK price analysis
LINK's daily chart has broken above the $12 to $12.20 resistance zone after spending much of August below it, with price now trading near $13.26.
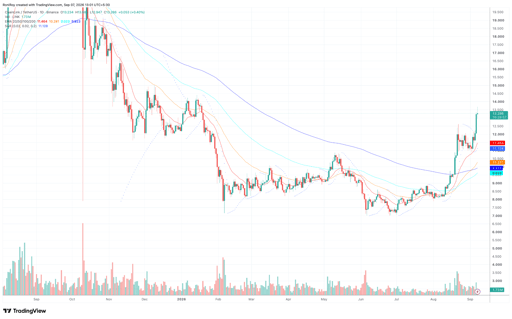
LINK/USDT 1-day price chart. Source: TradingView.
The latest daily candle reached roughly $13.68, putting $14 within range if LINK holds above the former breakout area.
All four exponential moving averages on the daily chart now sit below the market price.
The 20-day EMA stands at $11.46, followed by the 50-day EMA at $10.28, the 200-day EMA near $9.92 and the 100-day EMA at $9.62.
The 20-day EMA has pulled sharply away from the 50-day EMA as LINK has accelerated since August, while price has moved above the 200-day EMA after spending several months below it.
A pullback would therefore put $12 to $12.20 first in focus, followed by the 20-day EMA around $11.46 if the breakout fails to hold.
Parabolic SAR dots on the daily chart have moved below the candles, with the latest reading near $11.13.
LINK remaining above the dots supports continuation of the current uptrend, while a reversal in the SAR above price would provide an early warning that the move from the August lows is losing momentum.
On the 4-hour chart, TRIX has risen to 23.31 after recovering from negative territory in early September.
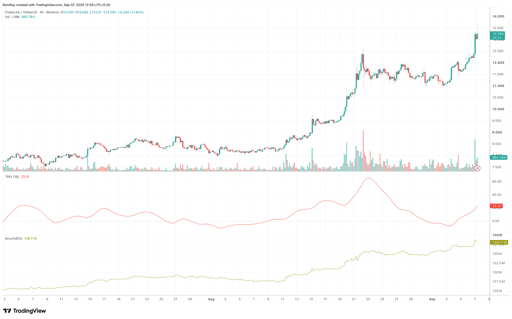
LINK/USDT 4-hour price chart. Source: TradingView.
The indicator has accelerated alongside LINK's move through $12 and $13, showing that the rate of price change is still increasing.
A turn lower in TRIX while LINK struggles below its recent high near $13.68 would weaken that momentum signal.
Accumulation/Distribution has reached roughly 138.1 million, up from around 125 million in early July.
The indicator made a fresh jump alongside the latest price breakout, while trading volume expanded sharply as LINK crossed $13, showing that the move has been accompanied by buying pressure rather than price rising while accumulation falls.
A sustained break above the recent $13.68 high would put $14 as the first probable target.
Clearing that level could open a move towards the $15 to $15.50 area, where LINK traded during the fourth quarter of 2025.
On the downside, losing $12 would weaken the breakout and expose the 20-day EMA near $11.46, with the 50-day EMA around $10.28 becoming the next support if sellers push through that level.

Here’s why Bittensor (TAO), Near Protocol, and Venice Token rising

Why is HYPE stalling near $90 even as ETF inflows refuse to turn negative?

Is Zcash setting up for $1,300 as ETF demand keeps squeezing short sellers?

Wall Street is pouring into Bitcoin ETFs: why BTC is still trapped below $80,000

Crypto price predictions: Dogecoin, XRP, Venice Token (VVV)
No results found
Loading articles...
Failed to load articles. Please try again.