Why is Ethereum price stuck below $1600?

AI Sentiment: 22/100 Bearish
This score is generated through AI-driven analysis of the article's content.
powered by
Use options to monetize the “range-to-down” setup: ETH is stabilizing around $1,560–$1,590 but lacks trend reversal confirmation (RSI neutral, still below key EMAs). If $1,550 fails, the article flags a likely move back toward $1,510 and lower Fibonacci targets. Buy near-term puts (e.g., ETH 1–3 month puts with strikes around $1,550) to profit from a breakdown without needing a perfect timing call.
Key Risk: A sustained squeeze from $1,595–$1,600 short liquidations pushes ETH through $1,650 and keeps it there.
ETH is stuck below $1,600 because spot ETF outflows are persistent and on-chain activity is weakening (fees and dApp revenue down; staking yield only ~2.7%). The chart confirms a downtrend: ETH is below the 20/50/100/200 EMAs and keeps failing the $1,600 breakout. Short-term liquidity is also crowded with short liquidations near $1,595–$1,600, so any bounce is likely to be sold quickly back into the range. Sell ETH now and re-enter only after a clean hold above ~$1,605 then ~$1,650.
Key Risk: US spot ETH ETF outflows reverse sharply and ETH holds above $1,650, proving the $1,600 ceiling is broken.
- Weak network activity is weighing on the Ethereum price.
- Key technical levels continue to limit Ethereum's recovery.
- Ethereum needs stronger buying to reclaim $1,600.
Ethereum price has remained unable to hold above the $1,600 level as persistent ETF outflows, slowing onchain activity and regulatory uncertainty continue to weigh on investor sentiment.
According to market data, Ether ETH has repeatedly failed to sustain a breakout above $1,600 since last Thursday, even as lower oil prices improved expectations that central banks could adopt a more accommodative policy stance.
While that backdrop has supported equities and pushed bond yields higher, it has done little to revive demand for the second-largest cryptocurrency.
ETH has fallen roughly 31% since May, underperforming the total cryptocurrency market by about 8% over the same period.
The token traded near $1,590 at the time of writing after recovering from recent lows around $1,510, although it remained down 4.9% over the past seven days and more than 20% over the last month.
One of the biggest headwinds has been institutional fund flows.
US-listed spot Ether exchange-traded funds have recorded net outflows of approximately $345 million (approx. Rs 96.5 billion) since June 17, outweighing the combined $182 million (approx. Rs 50.9 billion) worth of ETH accumulated by treasury companies BitMine Immersion and SharpLink during the same period.
The continued withdrawals have limited the impact of corporate buying on price action.
Regulatory uncertainty has also kept investors cautious. The Digital Asset Market CLARITY Act has remained pending in the US Senate since May 15.
The proposed legislation seeks to define which digital assets qualify as securities while ending regulation through enforcement actions.
However, debate over stablecoin yield provisions, anti-money laundering requirements, and ethical concerns surrounding the Trump family's association with the World Liberty Financial crypto platform has delayed progress.
Although many market participants view the legislation as supportive of decentralized finance if enacted, the lack of clarity has continued to discourage institutional positioning in Ethereum.
Competition for enterprise adoption has added another challenge.
Cloud providers have increasingly promoted artificial intelligence services built on agentic architectures, reducing blockchain's appeal for certain data processing workloads.
Enterprise software company SAP recently integrated autonomous modular AI agents across multi-cloud environments, highlighting how AI infrastructure is attracting attention that previously flowed toward blockchain technology.
Can Ethereum price reclaim $1,600?
Ethereum's on-chain activity continues to provide little support for a sustained recovery.
Network fees dropped to $10.7 million (approx. Rs 3 billion) in June from $24.4 million (approx. Rs 6.8 billion) in April, while decentralised application revenue declined to $5.2 million (approx. Rs 1.4 billion) from $6.5 million (approx. Rs 1.8 billion) over the same period.
Sky, formerly Maker, generated $1.3 million (approx. Rs 355.1 million) in revenue during June, followed by Titan Builder with $7.2 million (approx. Rs 2 billion) and Chainlink with $4.6 million (approx. Rs 1.3 billion).
Lower fee generation has kept ETH's supply inflationary, while staking yields remain around 2.7%, reducing incentives for long-term participation in the ecosystem.
Technical indicators show that the token is stabilising but has yet to confirm a trend reversal.
On the four-hour chart, ETH is trading inside a high-volume trading zone around $1,560 to $1,590, indicating that buyers and sellers remain active at current levels.
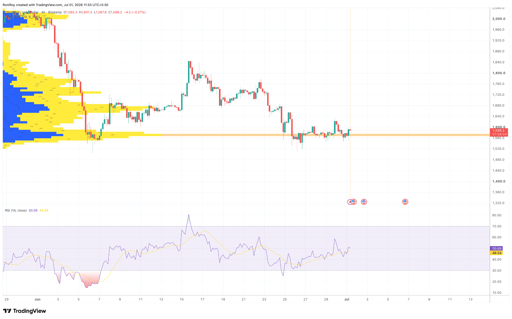
ETH/USD 4-hour price chart. Source: TradingView.
The relative strength index has recovered to around the neutral 50 mark after rebounding from oversold territory, suggesting selling pressure has eased without handing clear control to buyers.
Ethereum also remains below its 20, 50, 100, and 200 exponential moving averages, leaving the broader trend tilted to the downside.
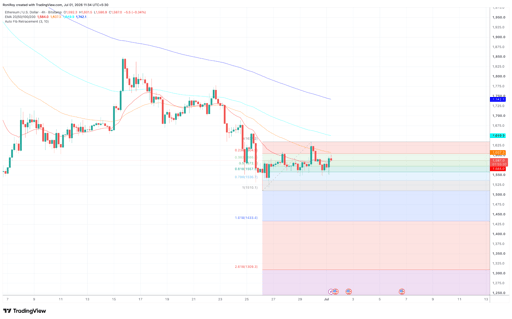
ETH/USD 4-hour price chart. Source: TradingView.
The 20 EMA near $1,584 is being tested, while the 50 EMA around $1,607 represents the first important resistance.
Higher resistance sits near the 100 EMA at roughly $1,650, with the 200 EMA around $1,742 continuing to cap the longer-term structure.
Fibonacci retracement levels also point to $1,600 as a decisive area.
ETH has climbed back above the 0.618 retracement after bouncing from the recent low near $1,510 and is now trading between the 0.5 and 0.382 retracement levels.
A sustained move above the 0.236 retracement near $1,605 could improve short-term momentum and expose resistance around $1,650.
If buyers fail to hold current support, the charts indicate renewed downside risk toward the $1,550-$1,510 range, with deeper Fibonacci extension targets around $1,433 and $1,309 remaining possible if the recent lows are broken.
Liquidation data also points to an important battle around current prices.
CoinGlass' 24-hour liquidation heatmap shows the largest cluster of short liquidations concentrated near $1,595-$1,600, meaning a breakout above this area could trigger forced buying and accelerate gains toward the next liquidity pockets around $1,610-$1,620 and later $1,645-$1,655.
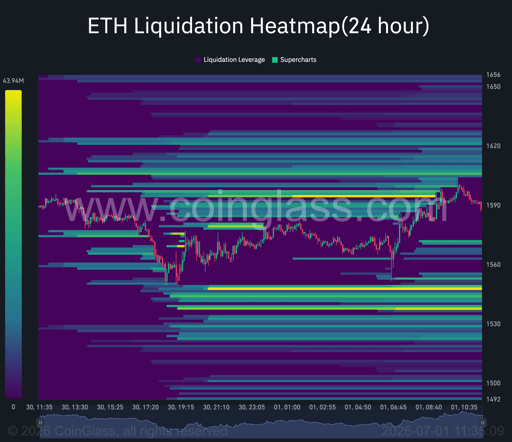
ETH 24-hour liquidation heatmap. Source: Coinglass.
On the downside, the largest concentration of long liquidations sits near $1,545-$1,550, followed by another dense zone between roughly $1,525 and $1,535, making those levels key support if selling pressure returns.
While Ethereum supporters continue to argue that tokenization remains in its early stages and that the network's role in real-world asset issuance could eventually support higher valuations.
> Trillions will be tokenised
— Etc. (@ec265) June 30, 2026
> Over half of tokenised assets are on Ethereum
> Tokenised assets need security
> ETH secures Ethereum
It's simple math, really https://t.co/19ZUv3bfp0 pic.twitter.com/mqyPe3TS4X
For now, however, Ethereum hosts about $16 billion (approx. Rs 4.5 trillion) worth of tokenized real-world assets, a figure that has yet to generate enough decentralised finance activity to offset weak network usage and persistent institutional outflows, leaving the cryptocurrency struggling to establish itself above the $1,600 threshold.

JTO price prediction as Jito launches JTX self-custodial trading platform

Zcash price prediction: Can ZEC break above $562 after the Ironwood upgrade?

SUI price prediction: Bullish accumulation signals build

Interview: Agentic AI to drive blockchain adoption, says Animoca Brands' Evan Auyang

ONDO price jumps 13%: can DTCC link drive a bigger breakout?
No results found
Loading articles...
Failed to load articles. Please try again.